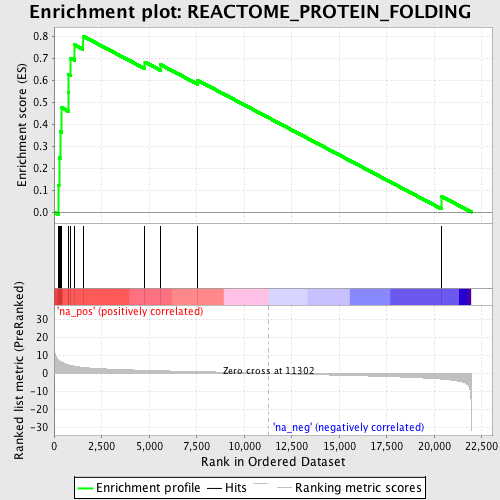
Profile of the Running ES Score & Positions of GeneSet Members on the Rank Ordered List
| Dataset | set01_ATM_minus_versus_SCID |
| Phenotype | NoPhenotypeAvailable |
| Upregulated in class | na_pos |
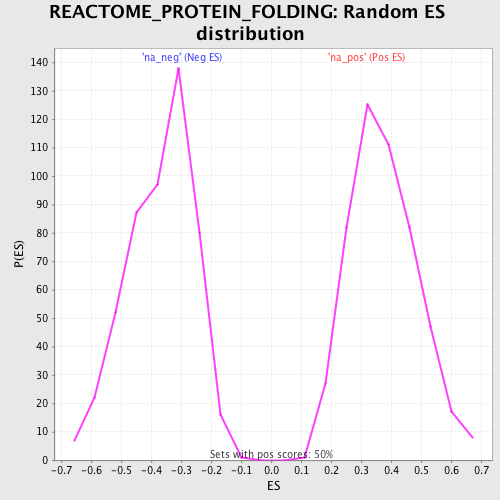
| GeneSet | REACTOME_PROTEIN_FOLDING |
| Enrichment Score (ES) | 0.8002043 |
| Normalized Enrichment Score (NES) | 2.1343918 |
| Nominal p-value | 0.0 |
| FDR q-value | 0.008603252 |
| FWER p-Value | 0.024 |
| PROBE | GENE SYMBOL | GENE_TITLE | RANK IN GENE LIST | RANK METRIC SCORE | RUNNING ES | CORE ENRICHMENT | |
|---|---|---|---|---|---|---|---|
| 1 | CCT6A | 247 | 7.235 | 0.1195 | Yes | ||
| 2 | CCT2 | 259 | 7.109 | 0.2474 | Yes | ||
| 3 | VBP1 | 314 | 6.733 | 0.3666 | Yes | ||
| 4 | CCT5 | 400 | 6.178 | 0.4744 | Yes | ||
| 5 | CCT4 | 750 | 4.659 | 0.5427 | Yes | ||
| 6 | TBCE | 764 | 4.634 | 0.6258 | Yes | ||
| 7 | CCT3 | 881 | 4.358 | 0.6993 | Yes | ||
| 8 | PFDN6 | 1092 | 3.901 | 0.7602 | Yes | ||
| 9 | CCT8 | 1520 | 3.291 | 0.8002 | Yes | ||
| 10 | PFDN1 | 4782 | 1.672 | 0.6818 | No | ||
| 11 | TBCC | 5583 | 1.436 | 0.6712 | No | ||
| 12 | TBCA | 7546 | 0.977 | 0.5995 | No | ||
| 13 | ACTB | 20378 | -3.156 | 0.0715 | No |