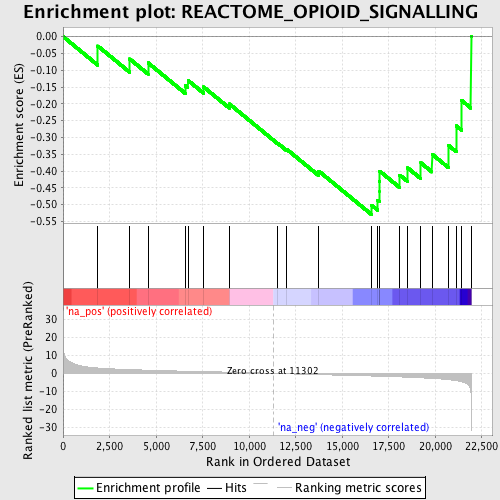
Profile of the Running ES Score & Positions of GeneSet Members on the Rank Ordered List
| Dataset | set01_ATM_minus_versus_SCID |
| Phenotype | NoPhenotypeAvailable |
| Upregulated in class | na_neg |
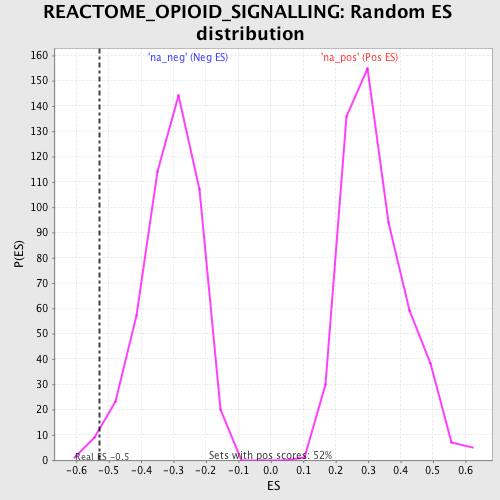
| GeneSet | REACTOME_OPIOID_SIGNALLING |
| Enrichment Score (ES) | -0.5293074 |
| Normalized Enrichment Score (NES) | -1.7083635 |
| Nominal p-value | 0.008421052 |
| FDR q-value | 0.5455874 |
| FWER p-Value | 0.966 |
| PROBE | GENE SYMBOL | GENE_TITLE | RANK IN GENE LIST | RANK METRIC SCORE | RUNNING ES | CORE ENRICHMENT | |
|---|---|---|---|---|---|---|---|
| 1 | PPP3R1 | 1862 | 2.972 | -0.0280 | No | ||
| 2 | CREB1 | 3579 | 2.070 | -0.0665 | No | ||
| 3 | GNG2 | 4568 | 1.745 | -0.0781 | No | ||
| 4 | PLCB2 | 6566 | 1.204 | -0.1462 | No | ||
| 5 | PRKAR2B | 6710 | 1.168 | -0.1303 | No | ||
| 6 | GNAZ | 7548 | 0.977 | -0.1497 | No | ||
| 7 | GNAL | 8933 | 0.653 | -0.2003 | No | ||
| 8 | PLA2G4A | 11535 | -0.076 | -0.3175 | No | ||
| 9 | PDYN | 12012 | -0.213 | -0.3351 | No | ||
| 10 | ADCY6 | 13734 | -0.708 | -0.4000 | No | ||
| 11 | PDE4D | 16569 | -1.458 | -0.5014 | Yes | ||
| 12 | OPRM1 | 16905 | -1.553 | -0.4869 | Yes | ||
| 13 | GNA14 | 16990 | -1.582 | -0.4604 | Yes | ||
| 14 | CDK5 | 16995 | -1.585 | -0.4302 | Yes | ||
| 15 | CALM1 | 17015 | -1.591 | -0.4005 | Yes | ||
| 16 | GNAI1 | 18087 | -1.955 | -0.4119 | Yes | ||
| 17 | PPP1CA | 18517 | -2.126 | -0.3907 | Yes | ||
| 18 | PRKACA | 19225 | -2.460 | -0.3758 | Yes | ||
| 19 | GNB1 | 19821 | -2.776 | -0.3497 | Yes | ||
| 20 | CAMK4 | 20719 | -3.468 | -0.3241 | Yes | ||
| 21 | PDE4B | 21123 | -4.010 | -0.2656 | Yes | ||
| 22 | PRKACB | 21416 | -4.640 | -0.1900 | Yes | ||
| 23 | ADRBK1 | 21916 | -11.172 | 0.0014 | Yes |