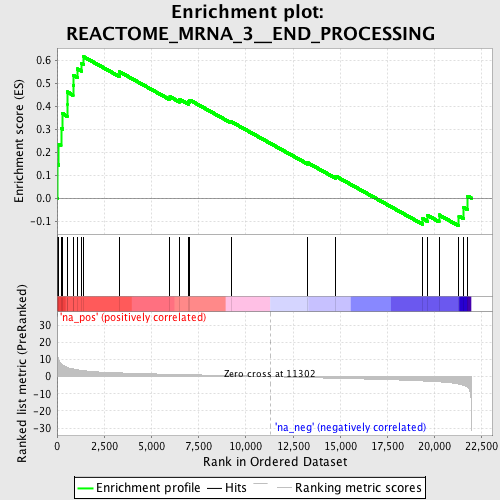
Profile of the Running ES Score & Positions of GeneSet Members on the Rank Ordered List
| Dataset | set01_ATM_minus_versus_SCID |
| Phenotype | NoPhenotypeAvailable |
| Upregulated in class | na_pos |
| GeneSet | REACTOME_MRNA_3__END_PROCESSING |
| Enrichment Score (ES) | 0.6160559 |
| Normalized Enrichment Score (NES) | 1.9739453 |
| Nominal p-value | 0.0 |
| FDR q-value | 0.014335983 |
| FWER p-Value | 0.222 |
| PROBE | GENE SYMBOL | GENE_TITLE | RANK IN GENE LIST | RANK METRIC SCORE | RUNNING ES | CORE ENRICHMENT | |
|---|---|---|---|---|---|---|---|
| 1 | SFRS2 | 12 | 15.098 | 0.1464 | Yes | ||
| 2 | SFRS11 | 88 | 9.493 | 0.2354 | Yes | ||
| 3 | SFRS7 | 206 | 7.661 | 0.3046 | Yes | ||
| 4 | CSTF2 | 292 | 6.925 | 0.3682 | Yes | ||
| 5 | NUDT21 | 530 | 5.452 | 0.4104 | Yes | ||
| 6 | SFRS6 | 535 | 5.431 | 0.4631 | Yes | ||
| 7 | SFRS1 | 843 | 4.448 | 0.4924 | Yes | ||
| 8 | SRRM1 | 864 | 4.408 | 0.5344 | Yes | ||
| 9 | NCBP2 | 1070 | 3.938 | 0.5634 | Yes | ||
| 10 | NFX1 | 1277 | 3.599 | 0.5890 | Yes | ||
| 11 | THOC4 | 1414 | 3.416 | 0.6161 | Yes | ||
| 12 | PCF11 | 3289 | 2.185 | 0.5518 | No | ||
| 13 | MAGOH | 5979 | 1.338 | 0.4422 | No | ||
| 14 | SFRS9 | 6490 | 1.219 | 0.4308 | No | ||
| 15 | U2AF1 | 6951 | 1.111 | 0.4206 | No | ||
| 16 | SFRS3 | 7029 | 1.092 | 0.4278 | No | ||
| 17 | CSTF3 | 9224 | 0.588 | 0.3334 | No | ||
| 18 | CPSF1 | 13281 | -0.581 | 0.1540 | No | ||
| 19 | U2AF2 | 14773 | -0.978 | 0.0956 | No | ||
| 20 | SFRS4 | 19374 | -2.533 | -0.0896 | No | ||
| 21 | RNPS1 | 19627 | -2.669 | -0.0751 | No | ||
| 22 | PABPN1 | 20239 | -3.051 | -0.0733 | No | ||
| 23 | CDC40 | 21294 | -4.345 | -0.0791 | No | ||
| 24 | PAPOLA | 21551 | -5.071 | -0.0414 | No | ||
| 25 | CSTF1 | 21753 | -6.103 | 0.0088 | No |
