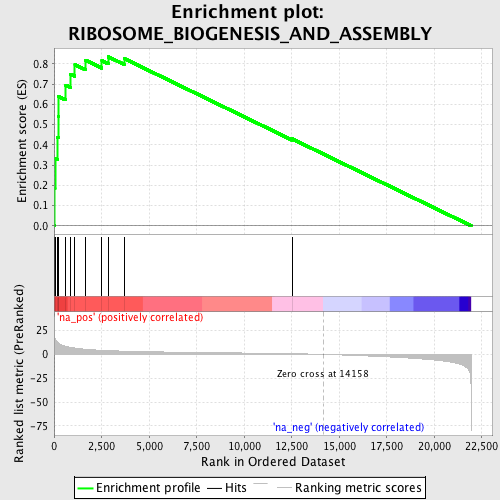
Profile of the Running ES Score & Positions of GeneSet Members on the Rank Ordered List
| Dataset | set01_ATM_minus_versus_ATM_plus |
| Phenotype | NoPhenotypeAvailable |
| Upregulated in class | na_pos |
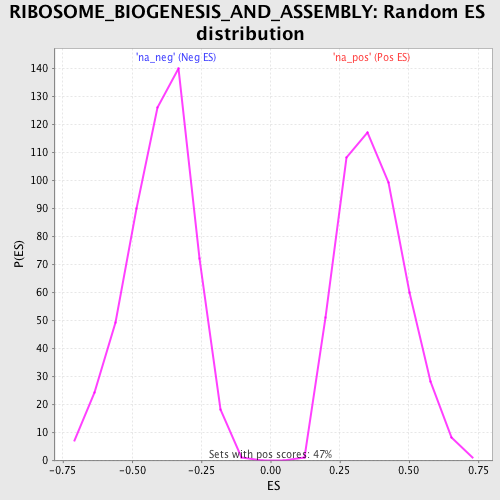
| GeneSet | RIBOSOME_BIOGENESIS_AND_ASSEMBLY |
| Enrichment Score (ES) | 0.83480316 |
| Normalized Enrichment Score (NES) | 2.2605543 |
| Nominal p-value | 0.0 |
| FDR q-value | 0.0 |
| FWER p-Value | 0.0 |
| PROBE | GENE SYMBOL | GENE_TITLE | RANK IN GENE LIST | RANK METRIC SCORE | RUNNING ES | CORE ENRICHMENT | |
|---|---|---|---|---|---|---|---|
| 1 | FBL | 19 | 21.204 | 0.1865 | Yes | ||
| 2 | NPM1 | 47 | 16.903 | 0.3347 | Yes | ||
| 3 | POP4 | 183 | 12.339 | 0.4375 | Yes | ||
| 4 | NOLC1 | 225 | 11.590 | 0.5381 | Yes | ||
| 5 | NOLA2 | 236 | 11.479 | 0.6391 | Yes | ||
| 6 | EXOSC2 | 617 | 8.340 | 0.6955 | Yes | ||
| 7 | NOL5A | 873 | 7.320 | 0.7485 | Yes | ||
| 8 | EIF2A | 1097 | 6.555 | 0.7963 | Yes | ||
| 9 | SDAD1 | 1640 | 5.333 | 0.8187 | Yes | ||
| 10 | GEMIN4 | 2516 | 4.195 | 0.8159 | Yes | ||
| 11 | EXOSC7 | 2858 | 3.901 | 0.8348 | Yes | ||
| 12 | EXOSC3 | 3686 | 3.316 | 0.8264 | No | ||
| 13 | RPS14 | 12522 | 0.686 | 0.4297 | No |