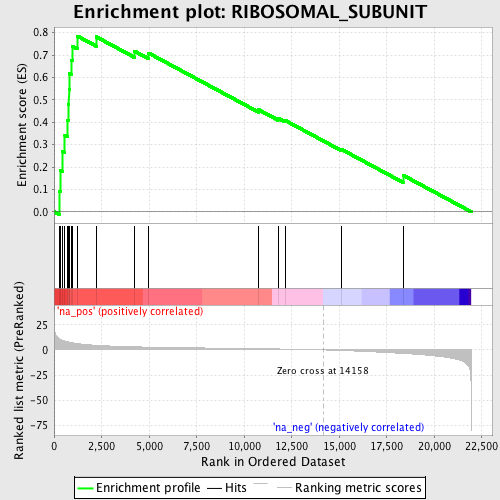
Profile of the Running ES Score & Positions of GeneSet Members on the Rank Ordered List
| Dataset | set01_ATM_minus_versus_ATM_plus |
| Phenotype | NoPhenotypeAvailable |
| Upregulated in class | na_pos |
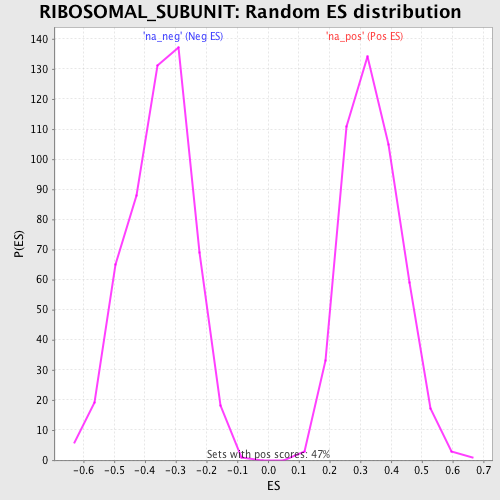
| GeneSet | RIBOSOMAL_SUBUNIT |
| Enrichment Score (ES) | 0.78481317 |
| Normalized Enrichment Score (NES) | 2.3189065 |
| Nominal p-value | 0.0 |
| FDR q-value | 0.0 |
| FWER p-Value | 0.0 |
| PROBE | GENE SYMBOL | GENE_TITLE | RANK IN GENE LIST | RANK METRIC SCORE | RUNNING ES | CORE ENRICHMENT | |
|---|---|---|---|---|---|---|---|
| 1 | MRPS36 | 263 | 11.174 | 0.0909 | Yes | ||
| 2 | MRPL12 | 316 | 10.627 | 0.1864 | Yes | ||
| 3 | MRPS11 | 421 | 9.615 | 0.2702 | Yes | ||
| 4 | MRPS18A | 567 | 8.597 | 0.3427 | Yes | ||
| 5 | MRPS22 | 705 | 7.954 | 0.4097 | Yes | ||
| 6 | MRPS35 | 746 | 7.786 | 0.4796 | Yes | ||
| 7 | MRPS18C | 783 | 7.653 | 0.5484 | Yes | ||
| 8 | MRPL51 | 811 | 7.526 | 0.6165 | Yes | ||
| 9 | MRPS28 | 930 | 7.107 | 0.6766 | Yes | ||
| 10 | MRPS15 | 953 | 7.020 | 0.7402 | Yes | ||
| 11 | MRPL55 | 1231 | 6.214 | 0.7848 | Yes | ||
| 12 | MRPL23 | 2213 | 4.530 | 0.7818 | No | ||
| 13 | MRPS16 | 4239 | 3.023 | 0.7173 | No | ||
| 14 | MRPL41 | 4974 | 2.731 | 0.7090 | No | ||
| 15 | RPL13A | 10754 | 1.199 | 0.4565 | No | ||
| 16 | MRPL10 | 11785 | 0.910 | 0.4179 | No | ||
| 17 | MRPS24 | 12152 | 0.797 | 0.4086 | No | ||
| 18 | MRPS21 | 15125 | -0.632 | 0.2788 | No | ||
| 19 | MRPL52 | 18366 | -3.498 | 0.1633 | No |