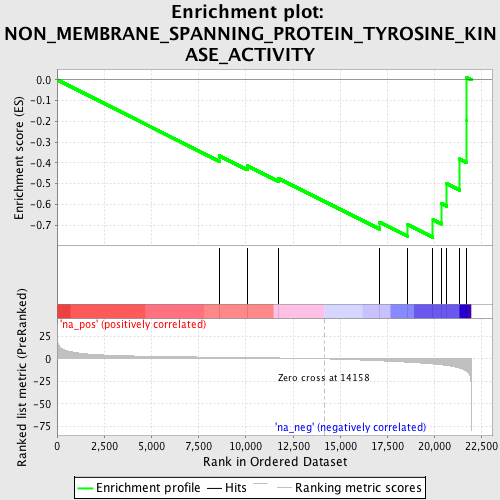
Profile of the Running ES Score & Positions of GeneSet Members on the Rank Ordered List
| Dataset | set01_ATM_minus_versus_ATM_plus |
| Phenotype | NoPhenotypeAvailable |
| Upregulated in class | na_neg |
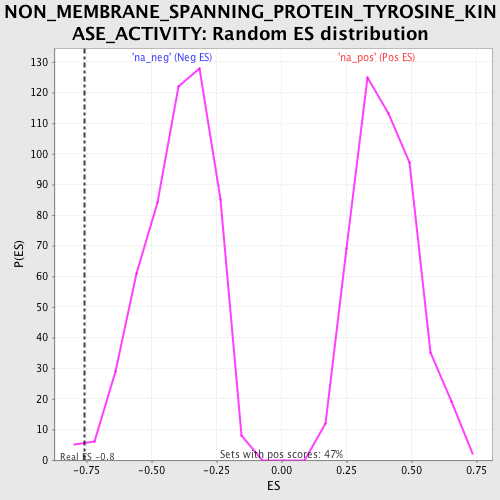
| GeneSet | NON_MEMBRANE_SPANNING_PROTEIN_TYROSINE_KINASE_ACTIVITY |
| Enrichment Score (ES) | -0.759312 |
| Normalized Enrichment Score (NES) | -1.9053742 |
| Nominal p-value | 0.009469697 |
| FDR q-value | 0.030796353 |
| FWER p-Value | 0.486 |
| PROBE | GENE SYMBOL | GENE_TITLE | RANK IN GENE LIST | RANK METRIC SCORE | RUNNING ES | CORE ENRICHMENT | |
|---|---|---|---|---|---|---|---|
| 1 | FRK | 8587 | 1.722 | -0.3658 | No | ||
| 2 | PTK6 | 10077 | 1.363 | -0.4133 | No | ||
| 3 | ERBB2 | 11721 | 0.927 | -0.4744 | No | ||
| 4 | TYK2 | 17095 | -2.213 | -0.6864 | No | ||
| 5 | CLK1 | 18579 | -3.733 | -0.6984 | Yes | ||
| 6 | TNK2 | 19917 | -5.699 | -0.6744 | Yes | ||
| 7 | TXK | 20361 | -6.619 | -0.5960 | Yes | ||
| 8 | DYRK1A | 20638 | -7.321 | -0.4995 | Yes | ||
| 9 | ITK | 21334 | -10.083 | -0.3809 | Yes | ||
| 10 | PTK2B | 21693 | -13.678 | -0.1934 | Yes | ||
| 11 | TEC | 21697 | -13.757 | 0.0114 | Yes |