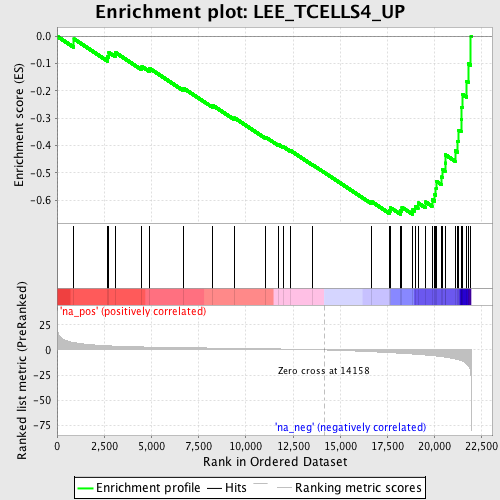
Profile of the Running ES Score & Positions of GeneSet Members on the Rank Ordered List
| Dataset | set01_ATM_minus_versus_ATM_plus |
| Phenotype | NoPhenotypeAvailable |
| Upregulated in class | na_neg |
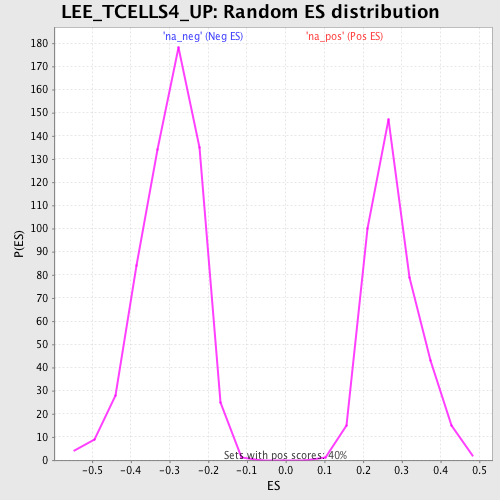
| GeneSet | LEE_TCELLS4_UP |
| Enrichment Score (ES) | -0.652818 |
| Normalized Enrichment Score (NES) | -2.1840744 |
| Nominal p-value | 0.0 |
| FDR q-value | 9.928542E-4 |
| FWER p-Value | 0.01 |
| PROBE | GENE SYMBOL | GENE_TITLE | RANK IN GENE LIST | RANK METRIC SCORE | RUNNING ES | CORE ENRICHMENT | |
|---|---|---|---|---|---|---|---|
| 1 | TNFSF10 | 893 | 7.236 | -0.0097 | No | ||
| 2 | ANK3 | 2682 | 4.033 | -0.0740 | No | ||
| 3 | SEMA4C | 2743 | 3.985 | -0.0596 | No | ||
| 4 | NELL2 | 3085 | 3.745 | -0.0591 | No | ||
| 5 | ABP1 | 4493 | 2.916 | -0.1108 | No | ||
| 6 | DENND2D | 4909 | 2.752 | -0.1179 | No | ||
| 7 | SLC2A3 | 6711 | 2.195 | -0.1907 | No | ||
| 8 | CD44 | 8241 | 1.803 | -0.2527 | No | ||
| 9 | MAN1C1 | 9401 | 1.530 | -0.2990 | No | ||
| 10 | LDLRAP1 | 11056 | 1.120 | -0.3697 | No | ||
| 11 | IFITM2 | 11709 | 0.933 | -0.3955 | No | ||
| 12 | LRRN3 | 11997 | 0.843 | -0.4049 | No | ||
| 13 | EMP3 | 12355 | 0.738 | -0.4181 | No | ||
| 14 | IFITM1 | 13553 | 0.295 | -0.4714 | No | ||
| 15 | COTL1 | 16639 | -1.789 | -0.6046 | No | ||
| 16 | RNASET2 | 17625 | -2.717 | -0.6379 | No | ||
| 17 | GPR171 | 17681 | -2.762 | -0.6285 | No | ||
| 18 | BTLA | 18207 | -3.336 | -0.6381 | Yes | ||
| 19 | ACTN1 | 18273 | -3.406 | -0.6265 | Yes | ||
| 20 | ATM | 18851 | -4.077 | -0.6353 | Yes | ||
| 21 | TNFRSF25 | 18964 | -4.227 | -0.6223 | Yes | ||
| 22 | PRMT2 | 19127 | -4.466 | -0.6105 | Yes | ||
| 23 | GBP2 | 19528 | -5.087 | -0.6069 | Yes | ||
| 24 | CYLD | 19870 | -5.610 | -0.5983 | Yes | ||
| 25 | TNFRSF7 | 20015 | -5.900 | -0.5796 | Yes | ||
| 26 | TUBA1 | 20075 | -6.030 | -0.5563 | Yes | ||
| 27 | GIMAP7 | 20109 | -6.088 | -0.5317 | Yes | ||
| 28 | TBC1D4 | 20378 | -6.661 | -0.5153 | Yes | ||
| 29 | IL27RA | 20407 | -6.750 | -0.4876 | Yes | ||
| 30 | FOXO1A | 20562 | -7.105 | -0.4641 | Yes | ||
| 31 | AMIGO2 | 20585 | -7.160 | -0.4343 | Yes | ||
| 32 | PDE4DIP | 21093 | -8.898 | -0.4193 | Yes | ||
| 33 | IL4R | 21228 | -9.529 | -0.3844 | Yes | ||
| 34 | KLF2 | 21287 | -9.840 | -0.3448 | Yes | ||
| 35 | GIMAP4 | 21410 | -10.594 | -0.3049 | Yes | ||
| 36 | EDG1 | 21430 | -10.786 | -0.2594 | Yes | ||
| 37 | EBI2 | 21497 | -11.298 | -0.2139 | Yes | ||
| 38 | PSCDBP | 21699 | -13.765 | -0.1639 | Yes | ||
| 39 | MAP3K1 | 21803 | -15.769 | -0.1009 | Yes | ||
| 40 | CCR7 | 21931 | -25.001 | 0.0007 | Yes |