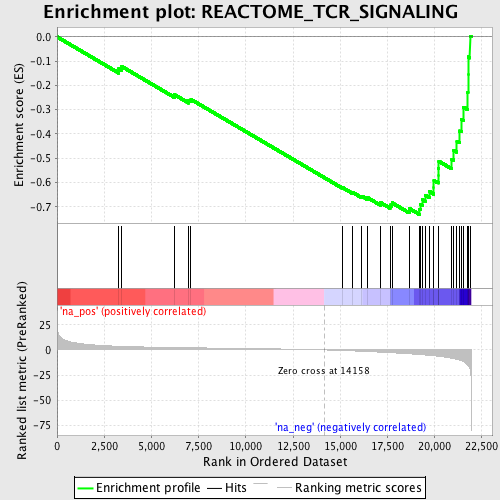
Profile of the Running ES Score & Positions of GeneSet Members on the Rank Ordered List
| Dataset | set01_ATM_minus_versus_ATM_plus |
| Phenotype | NoPhenotypeAvailable |
| Upregulated in class | na_neg |
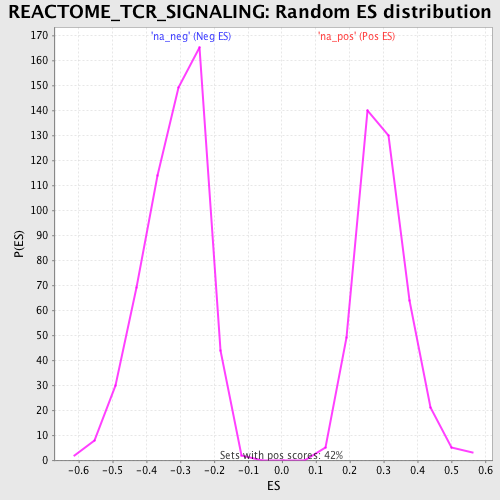
| GeneSet | REACTOME_TCR_SIGNALING |
| Enrichment Score (ES) | -0.73185676 |
| Normalized Enrichment Score (NES) | -2.300955 |
| Nominal p-value | 0.0 |
| FDR q-value | 0.0 |
| FWER p-Value | 0.0 |
| PROBE | GENE SYMBOL | GENE_TITLE | RANK IN GENE LIST | RANK METRIC SCORE | RUNNING ES | CORE ENRICHMENT | |
|---|---|---|---|---|---|---|---|
| 1 | ENAH | 3272 | 3.606 | -0.1319 | No | ||
| 2 | UBE2N | 3412 | 3.489 | -0.1214 | No | ||
| 3 | PIK3R1 | 6230 | 2.327 | -0.2387 | No | ||
| 4 | MAP3K7 | 6975 | 2.124 | -0.2624 | No | ||
| 5 | NFKB1 | 7091 | 2.093 | -0.2576 | No | ||
| 6 | PIK3CB | 15122 | -0.630 | -0.6209 | No | ||
| 7 | LAT | 15646 | -0.971 | -0.6401 | No | ||
| 8 | RIPK2 | 16143 | -1.360 | -0.6562 | No | ||
| 9 | ZAP70 | 16444 | -1.608 | -0.6621 | No | ||
| 10 | NCK1 | 17148 | -2.262 | -0.6833 | No | ||
| 11 | CHUK | 17643 | -2.730 | -0.6927 | No | ||
| 12 | PAK1 | 17746 | -2.826 | -0.6837 | No | ||
| 13 | FYB | 18658 | -3.819 | -0.7068 | No | ||
| 14 | WAS | 19208 | -4.589 | -0.7097 | Yes | ||
| 15 | PTEN | 19245 | -4.642 | -0.6889 | Yes | ||
| 16 | CD3G | 19364 | -4.837 | -0.6710 | Yes | ||
| 17 | PTPRC | 19517 | -5.062 | -0.6535 | Yes | ||
| 18 | IKBKB | 19718 | -5.359 | -0.6368 | Yes | ||
| 19 | GRAP2 | 19967 | -5.818 | -0.6200 | Yes | ||
| 20 | CD3D | 19969 | -5.819 | -0.5920 | Yes | ||
| 21 | TRAT1 | 20193 | -6.255 | -0.5720 | Yes | ||
| 22 | PLCG1 | 20195 | -6.259 | -0.5418 | Yes | ||
| 23 | BCL10 | 20231 | -6.352 | -0.5127 | Yes | ||
| 24 | PRKCQ | 20917 | -8.226 | -0.5043 | Yes | ||
| 25 | RELA | 21022 | -8.671 | -0.4672 | Yes | ||
| 26 | CD4 | 21188 | -9.300 | -0.4298 | Yes | ||
| 27 | ITK | 21334 | -10.083 | -0.3878 | Yes | ||
| 28 | CSK | 21416 | -10.654 | -0.3401 | Yes | ||
| 29 | CD3E | 21545 | -11.647 | -0.2897 | Yes | ||
| 30 | LCP2 | 21764 | -14.815 | -0.2282 | Yes | ||
| 31 | NFKBIA | 21775 | -15.114 | -0.1557 | Yes | ||
| 32 | LCK | 21778 | -15.166 | -0.0826 | Yes | ||
| 33 | PDPK1 | 21879 | -18.696 | 0.0031 | Yes |