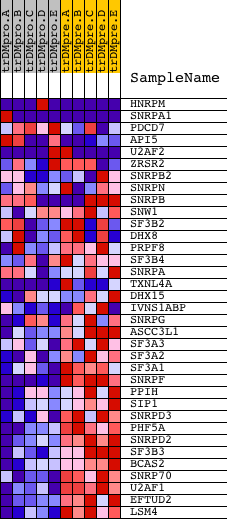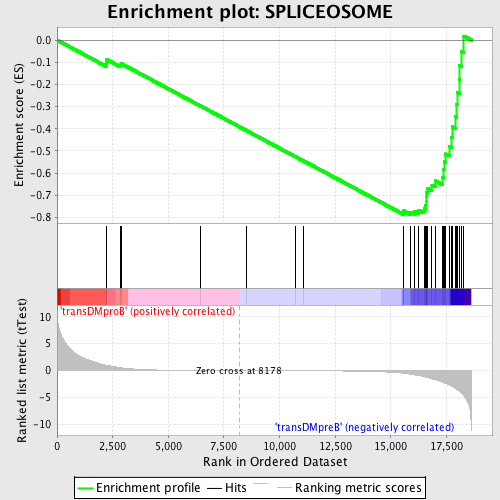
Profile of the Running ES Score & Positions of GeneSet Members on the Rank Ordered List
| Dataset | Set_04_transDMproB_versus_transDMpreB.phenotype_transDMproB_versus_transDMpreB.cls #transDMproB_versus_transDMpreB.phenotype_transDMproB_versus_transDMpreB.cls #transDMproB_versus_transDMpreB_repos |
| Phenotype | phenotype_transDMproB_versus_transDMpreB.cls#transDMproB_versus_transDMpreB_repos |
| Upregulated in class | transDMpreB |
| GeneSet | SPLICEOSOME |
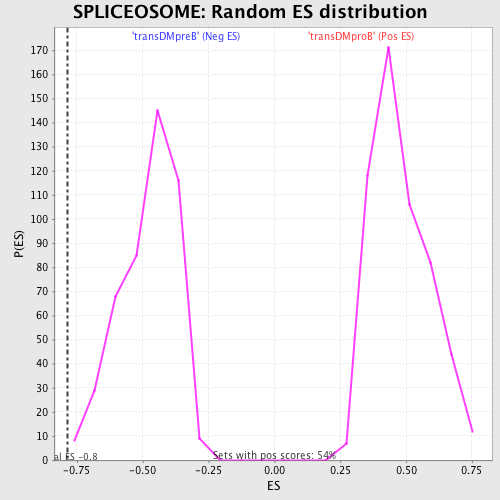
| Enrichment Score (ES) | -0.7870267 |
| Normalized Enrichment Score (NES) | -1.6407009 |
| Nominal p-value | 0.004347826 |
| FDR q-value | 0.035571977 |
| FWER p-Value | 0.436 |
| PROBE | DESCRIPTION (from dataset) | GENE SYMBOL | GENE_TITLE | RANK IN GENE LIST | RANK METRIC SCORE | RUNNING ES | CORE ENRICHMENT | |
|---|---|---|---|---|---|---|---|---|
| 1 | HNRPM | 1511 13370 | 2203 | 1.000 | -0.1024 | No | ||
| 2 | SNRPA1 | 1373 18216 | 2234 | 0.991 | -0.0880 | No | ||
| 3 | PDCD7 | 19402 | 2830 | 0.538 | -0.1113 | No | ||
| 4 | API5 | 8613 4400 8612 | 2885 | 0.511 | -0.1060 | No | ||
| 5 | U2AF2 | 5813 5812 5814 | 6448 | 0.026 | -0.2973 | No | ||
| 6 | ZRSR2 | 2554 2639 24013 | 8500 | -0.004 | -0.4076 | No | ||
| 7 | SNRPB2 | 5470 | 10695 | -0.034 | -0.5251 | No | ||
| 8 | SNRPN | 1715 9844 5471 | 11092 | -0.041 | -0.5458 | No | ||
| 9 | SNRPB | 9842 5469 2736 | 15571 | -0.515 | -0.7784 | Yes | ||
| 10 | SNW1 | 7282 | 15575 | -0.516 | -0.7702 | Yes | ||
| 11 | SF3B2 | 23974 | 15888 | -0.682 | -0.7760 | Yes | ||
| 12 | DHX8 | 20649 | 16062 | -0.808 | -0.7723 | Yes | ||
| 13 | PRPF8 | 20780 1371 | 16257 | -0.972 | -0.7670 | Yes | ||
| 14 | SF3B4 | 22269 | 16492 | -1.131 | -0.7613 | Yes | ||
| 15 | SNRPA | 7007 11992 7008 | 16563 | -1.214 | -0.7455 | Yes | ||
| 16 | TXNL4A | 6567 11329 | 16582 | -1.228 | -0.7266 | Yes | ||
| 17 | DHX15 | 8842 | 16588 | -1.232 | -0.7070 | Yes | ||
| 18 | IVNS1ABP | 4384 4050 | 16604 | -1.245 | -0.6877 | Yes | ||
| 19 | SNRPG | 12622 | 16664 | -1.317 | -0.6696 | Yes | ||
| 20 | ASCC3L1 | 14867 | 16848 | -1.547 | -0.6544 | Yes | ||
| 21 | SF3A3 | 16091 | 17000 | -1.699 | -0.6351 | Yes | ||
| 22 | SF3A2 | 19938 | 17326 | -2.138 | -0.6180 | Yes | ||
| 23 | SF3A1 | 7450 | 17384 | -2.247 | -0.5848 | Yes | ||
| 24 | SNRPF | 7645 | 17393 | -2.259 | -0.5487 | Yes | ||
| 25 | PPIH | 12287 | 17459 | -2.368 | -0.5140 | Yes | ||
| 26 | SIP1 | 21263 | 17619 | -2.696 | -0.4790 | Yes | ||
| 27 | SNRPD3 | 12514 | 17723 | -2.911 | -0.4375 | Yes | ||
| 28 | PHF5A | 22194 | 17755 | -2.970 | -0.3912 | Yes | ||
| 29 | SNRPD2 | 8412 | 17892 | -3.333 | -0.3447 | Yes | ||
| 30 | SF3B3 | 18746 | 17955 | -3.510 | -0.2913 | Yes | ||
| 31 | BCAS2 | 12662 | 17977 | -3.573 | -0.2347 | Yes | ||
| 32 | SNRP70 | 1186 | 18077 | -3.843 | -0.1779 | Yes | ||
| 33 | U2AF1 | 8431 | 18097 | -3.895 | -0.1160 | Yes | ||
| 34 | EFTUD2 | 1219 20203 | 18188 | -4.255 | -0.0521 | Yes | ||
| 35 | LSM4 | 18583 | 18282 | -4.650 | 0.0180 | Yes |