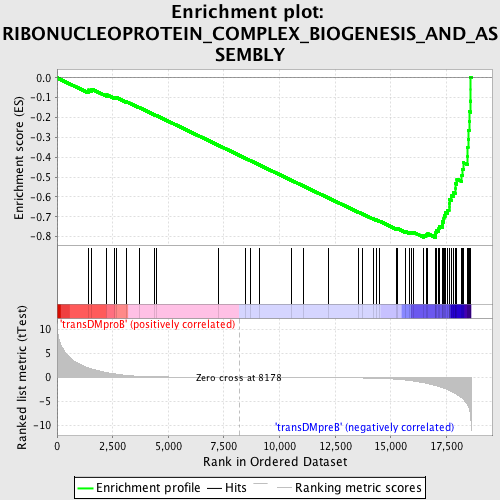
Profile of the Running ES Score & Positions of GeneSet Members on the Rank Ordered List
| Dataset | Set_04_transDMproB_versus_transDMpreB.phenotype_transDMproB_versus_transDMpreB.cls #transDMproB_versus_transDMpreB.phenotype_transDMproB_versus_transDMpreB.cls #transDMproB_versus_transDMpreB_repos |
| Phenotype | phenotype_transDMproB_versus_transDMpreB.cls#transDMproB_versus_transDMpreB_repos |
| Upregulated in class | transDMpreB |
| GeneSet | RIBONUCLEOPROTEIN_COMPLEX_BIOGENESIS_AND_ASSEMBLY |
| Enrichment Score (ES) | -0.80375445 |
| Normalized Enrichment Score (NES) | -1.8719796 |
| Nominal p-value | 0.0 |
| FDR q-value | 0.0 |
| FWER p-Value | 0.0 |
| PROBE | DESCRIPTION (from dataset) | GENE SYMBOL | GENE_TITLE | RANK IN GENE LIST | RANK METRIC SCORE | RUNNING ES | CORE ENRICHMENT | |
|---|---|---|---|---|---|---|---|---|
| 1 | EIF2AK3 | 17421 | 1401 | 1.959 | -0.0611 | No | ||
| 2 | PAIP2 | 12593 | 1556 | 1.739 | -0.0566 | No | ||
| 3 | ATXN2 | 9780 3506 | 2238 | 0.989 | -0.0860 | No | ||
| 4 | SFRS2IP | 7794 13009 | 2590 | 0.706 | -0.0997 | No | ||
| 5 | EIF2B2 | 21204 | 2683 | 0.637 | -0.1000 | No | ||
| 6 | SFRS8 | 10543 6089 | 3124 | 0.394 | -0.1208 | No | ||
| 7 | EIF4H | 16352 | 3683 | 0.215 | -0.1493 | No | ||
| 8 | EIF2C1 | 10672 | 4395 | 0.101 | -0.1868 | No | ||
| 9 | SRPK2 | 5513 | 4466 | 0.095 | -0.1899 | No | ||
| 10 | GEMIN6 | 12492 7415 | 7235 | 0.013 | -0.3390 | No | ||
| 11 | RPS14 | 9751 | 8450 | -0.004 | -0.4044 | No | ||
| 12 | DAZL | 22944 | 8673 | -0.006 | -0.4163 | No | ||
| 13 | EIF4A2 | 4660 1679 1645 | 9081 | -0.011 | -0.4381 | No | ||
| 14 | CRNKL1 | 14407 | 10520 | -0.031 | -0.5154 | No | ||
| 15 | NPM1 | 1196 | 11078 | -0.040 | -0.5451 | No | ||
| 16 | EIF2AK4 | 14909 | 12194 | -0.067 | -0.6047 | No | ||
| 17 | GEMIN7 | 17944 | 13533 | -0.124 | -0.6759 | No | ||
| 18 | BOLL | 7960 | 13742 | -0.141 | -0.6861 | No | ||
| 19 | EXOSC3 | 15890 | 14213 | -0.187 | -0.7100 | No | ||
| 20 | EIF4G3 | 10517 | 14342 | -0.203 | -0.7155 | No | ||
| 21 | CUGBP1 | 2805 8819 4576 2924 | 14499 | -0.225 | -0.7222 | No | ||
| 22 | SFRS1 | 8492 | 15244 | -0.391 | -0.7594 | No | ||
| 23 | PAIP1 | 21556 | 15304 | -0.411 | -0.7596 | No | ||
| 24 | HSPB1 | 4879 | 15659 | -0.555 | -0.7746 | No | ||
| 25 | POP4 | 7261 | 15844 | -0.652 | -0.7797 | No | ||
| 26 | MTIF2 | 13354 | 15924 | -0.710 | -0.7787 | No | ||
| 27 | PRPF31 | 7594 | 16026 | -0.782 | -0.7784 | No | ||
| 28 | SFRS9 | 16731 | 16466 | -1.109 | -0.7939 | Yes | ||
| 29 | TXNL4A | 6567 11329 | 16582 | -1.228 | -0.7910 | Yes | ||
| 30 | SFRS5 | 9808 2062 | 16665 | -1.319 | -0.7858 | Yes | ||
| 31 | SF3A3 | 16091 | 17000 | -1.699 | -0.7912 | Yes | ||
| 32 | RPS3A | 9755 | 17022 | -1.723 | -0.7797 | Yes | ||
| 33 | USP39 | 1116 1083 11373 | 17047 | -1.748 | -0.7681 | Yes | ||
| 34 | EIF4G2 | 1908 8892 | 17159 | -1.893 | -0.7601 | Yes | ||
| 35 | EIF5 | 5736 | 17173 | -1.912 | -0.7468 | Yes | ||
| 36 | DICER1 | 20989 | 17314 | -2.121 | -0.7387 | Yes | ||
| 37 | SF3A2 | 19938 | 17326 | -2.138 | -0.7235 | Yes | ||
| 38 | SF3A1 | 7450 | 17384 | -2.247 | -0.7101 | Yes | ||
| 39 | EIF4B | 13279 7979 | 17392 | -2.258 | -0.6938 | Yes | ||
| 40 | GEMIN4 | 6592 6591 | 17440 | -2.337 | -0.6791 | Yes | ||
| 41 | DDX20 | 15213 | 17544 | -2.502 | -0.6663 | Yes | ||
| 42 | SFRS6 | 14751 | 17617 | -2.689 | -0.6503 | Yes | ||
| 43 | SIP1 | 21263 | 17619 | -2.696 | -0.6305 | Yes | ||
| 44 | FUSIP1 | 4715 16036 | 17627 | -2.708 | -0.6110 | Yes | ||
| 45 | EXOSC7 | 19256 | 17718 | -2.898 | -0.5945 | Yes | ||
| 46 | GEMIN5 | 20439 | 17808 | -3.106 | -0.5764 | Yes | ||
| 47 | SNRPD2 | 8412 | 17892 | -3.333 | -0.5564 | Yes | ||
| 48 | SNRPD1 | 23622 | 17897 | -3.342 | -0.5320 | Yes | ||
| 49 | NOLC1 | 7704 | 17970 | -3.562 | -0.5096 | Yes | ||
| 50 | EIF2B4 | 16574 | 18192 | -4.269 | -0.4901 | Yes | ||
| 51 | EIF2B5 | 1719 22822 | 18220 | -4.393 | -0.4592 | Yes | ||
| 52 | EXOSC2 | 15044 | 18277 | -4.626 | -0.4282 | Yes | ||
| 53 | EIF2B1 | 16368 3458 | 18450 | -5.739 | -0.3952 | Yes | ||
| 54 | EIF1 | 23563 | 18457 | -5.837 | -0.3525 | Yes | ||
| 55 | EIF5A | 11345 20379 6590 | 18471 | -5.997 | -0.3091 | Yes | ||
| 56 | NOL5A | 12474 | 18495 | -6.196 | -0.2647 | Yes | ||
| 57 | SDAD1 | 16479 | 18522 | -6.466 | -0.2185 | Yes | ||
| 58 | FBL | 8955 | 18531 | -6.611 | -0.1702 | Yes | ||
| 59 | EIF2B3 | 16118 | 18573 | -7.596 | -0.1165 | Yes | ||
| 60 | RRP9 | 19328 | 18590 | -8.020 | -0.0583 | Yes | ||
| 61 | NOLA2 | 11972 | 18591 | -8.102 | 0.0013 | Yes |

