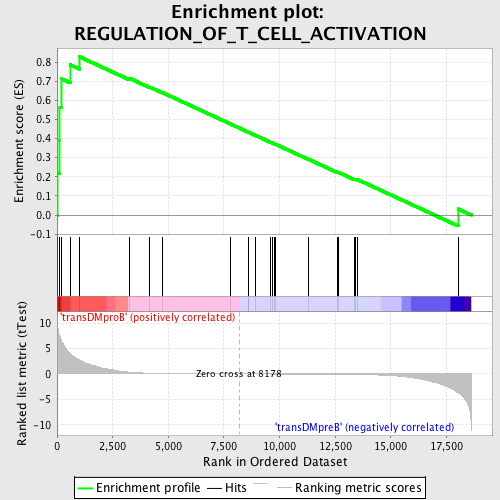
Profile of the Running ES Score & Positions of GeneSet Members on the Rank Ordered List
| Dataset | Set_04_transDMproB_versus_transDMpreB.phenotype_transDMproB_versus_transDMpreB.cls #transDMproB_versus_transDMpreB.phenotype_transDMproB_versus_transDMpreB.cls #transDMproB_versus_transDMpreB_repos |
| Phenotype | phenotype_transDMproB_versus_transDMpreB.cls#transDMproB_versus_transDMpreB_repos |
| Upregulated in class | transDMproB |
| GeneSet | REGULATION_OF_T_CELL_ACTIVATION |
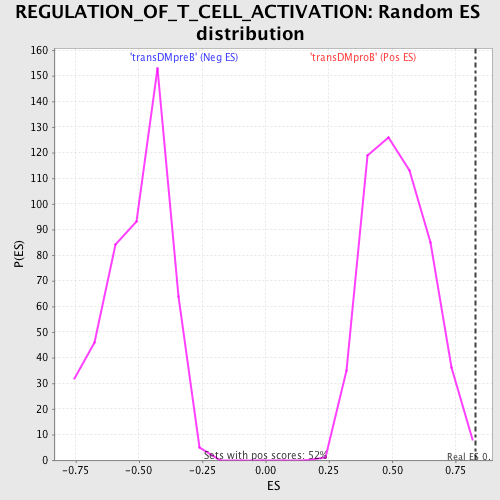
| Enrichment Score (ES) | 0.82790774 |
| Normalized Enrichment Score (NES) | 1.5878667 |
| Nominal p-value | 0.0057361377 |
| FDR q-value | 0.27592328 |
| FWER p-Value | 0.769 |
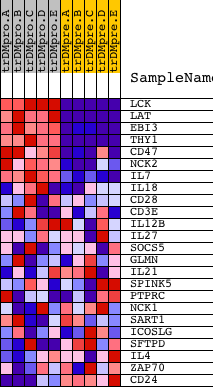
| PROBE | DESCRIPTION (from dataset) | GENE SYMBOL | GENE_TITLE | RANK IN GENE LIST | RANK METRIC SCORE | RUNNING ES | CORE ENRICHMENT | |
|---|---|---|---|---|---|---|---|---|
| 1 | LCK | 15746 | 27 | 9.283 | 0.2204 | Yes | ||
| 2 | LAT | 17643 | 124 | 7.317 | 0.3901 | Yes | ||
| 3 | EBI3 | 23193 | 127 | 7.299 | 0.5643 | Yes | ||
| 4 | THY1 | 19481 | 199 | 6.383 | 0.7131 | Yes | ||
| 5 | CD47 | 4933 | 596 | 3.950 | 0.7862 | Yes | ||
| 6 | NCK2 | 9448 | 1018 | 2.695 | 0.8279 | Yes | ||
| 7 | IL7 | 4921 | 3269 | 0.334 | 0.7149 | No | ||
| 8 | IL18 | 9172 | 4165 | 0.128 | 0.6698 | No | ||
| 9 | CD28 | 14239 4092 | 4745 | 0.076 | 0.6405 | No | ||
| 10 | CD3E | 8714 | 7771 | 0.006 | 0.4779 | No | ||
| 11 | IL12B | 20918 | 8591 | -0.005 | 0.4340 | No | ||
| 12 | IL27 | 17636 | 8592 | -0.005 | 0.4341 | No | ||
| 13 | SOCS5 | 1619 23141 | 8896 | -0.009 | 0.4180 | No | ||
| 14 | GLMN | 16452 3562 | 9613 | -0.018 | 0.3800 | No | ||
| 15 | IL21 | 12241 | 9664 | -0.019 | 0.3777 | No | ||
| 16 | SPINK5 | 23569 | 9763 | -0.020 | 0.3729 | No | ||
| 17 | PTPRC | 5327 9662 | 9820 | -0.021 | 0.3704 | No | ||
| 18 | NCK1 | 9447 5152 | 11287 | -0.044 | 0.2926 | No | ||
| 19 | SART1 | 23977 | 12589 | -0.079 | 0.2245 | No | ||
| 20 | ICOSLG | 19973 | 12628 | -0.081 | 0.2244 | No | ||
| 21 | SFTPD | 21867 | 13350 | -0.112 | 0.1883 | No | ||
| 22 | IL4 | 9174 | 13421 | -0.117 | 0.1873 | No | ||
| 23 | ZAP70 | 14271 4042 | 13513 | -0.123 | 0.1854 | No | ||
| 24 | CD24 | 8711 | 18026 | -3.725 | 0.0317 | No |