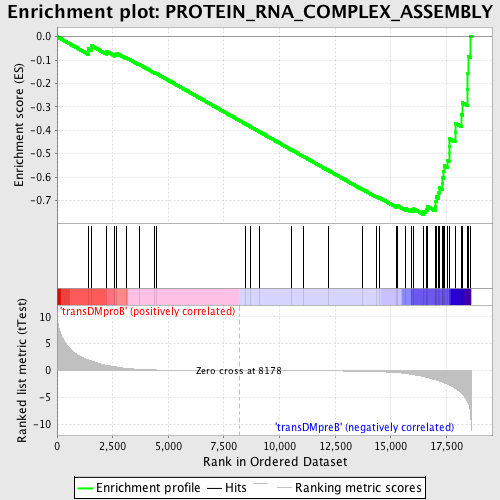
Profile of the Running ES Score & Positions of GeneSet Members on the Rank Ordered List
| Dataset | Set_04_transDMproB_versus_transDMpreB.phenotype_transDMproB_versus_transDMpreB.cls #transDMproB_versus_transDMpreB.phenotype_transDMproB_versus_transDMpreB.cls #transDMproB_versus_transDMpreB_repos |
| Phenotype | phenotype_transDMproB_versus_transDMpreB.cls#transDMproB_versus_transDMpreB_repos |
| Upregulated in class | transDMpreB |
| GeneSet | PROTEIN_RNA_COMPLEX_ASSEMBLY |
| Enrichment Score (ES) | -0.7598599 |
| Normalized Enrichment Score (NES) | -1.7082405 |
| Nominal p-value | 0.0022123894 |
| FDR q-value | 0.021660011 |
| FWER p-Value | 0.112 |
| PROBE | DESCRIPTION (from dataset) | GENE SYMBOL | GENE_TITLE | RANK IN GENE LIST | RANK METRIC SCORE | RUNNING ES | CORE ENRICHMENT | |
|---|---|---|---|---|---|---|---|---|
| 1 | EIF2AK3 | 17421 | 1401 | 1.959 | -0.0518 | No | ||
| 2 | PAIP2 | 12593 | 1556 | 1.739 | -0.0391 | No | ||
| 3 | ATXN2 | 9780 3506 | 2238 | 0.989 | -0.0639 | No | ||
| 4 | SFRS2IP | 7794 13009 | 2590 | 0.706 | -0.0742 | No | ||
| 5 | EIF2B2 | 21204 | 2683 | 0.637 | -0.0715 | No | ||
| 6 | SFRS8 | 10543 6089 | 3124 | 0.394 | -0.0905 | No | ||
| 7 | EIF4H | 16352 | 3683 | 0.215 | -0.1179 | No | ||
| 8 | EIF2C1 | 10672 | 4395 | 0.101 | -0.1550 | No | ||
| 9 | SRPK2 | 5513 | 4466 | 0.095 | -0.1576 | No | ||
| 10 | RPS14 | 9751 | 8450 | -0.004 | -0.3721 | No | ||
| 11 | DAZL | 22944 | 8673 | -0.006 | -0.3839 | No | ||
| 12 | EIF4A2 | 4660 1679 1645 | 9081 | -0.011 | -0.4057 | No | ||
| 13 | CRNKL1 | 14407 | 10520 | -0.031 | -0.4828 | No | ||
| 14 | NPM1 | 1196 | 11078 | -0.040 | -0.5123 | No | ||
| 15 | EIF2AK4 | 14909 | 12194 | -0.067 | -0.5715 | No | ||
| 16 | BOLL | 7960 | 13742 | -0.141 | -0.6531 | No | ||
| 17 | EIF4G3 | 10517 | 14342 | -0.203 | -0.6829 | No | ||
| 18 | CUGBP1 | 2805 8819 4576 2924 | 14499 | -0.225 | -0.6886 | No | ||
| 19 | SFRS1 | 8492 | 15244 | -0.391 | -0.7240 | No | ||
| 20 | PAIP1 | 21556 | 15304 | -0.411 | -0.7222 | No | ||
| 21 | HSPB1 | 4879 | 15659 | -0.555 | -0.7346 | No | ||
| 22 | MTIF2 | 13354 | 15924 | -0.710 | -0.7402 | No | ||
| 23 | PRPF31 | 7594 | 16026 | -0.782 | -0.7362 | No | ||
| 24 | SFRS9 | 16731 | 16466 | -1.109 | -0.7465 | Yes | ||
| 25 | TXNL4A | 6567 11329 | 16582 | -1.228 | -0.7379 | Yes | ||
| 26 | SFRS5 | 9808 2062 | 16665 | -1.319 | -0.7264 | Yes | ||
| 27 | SF3A3 | 16091 | 17000 | -1.699 | -0.7239 | Yes | ||
| 28 | RPS3A | 9755 | 17022 | -1.723 | -0.7042 | Yes | ||
| 29 | USP39 | 1116 1083 11373 | 17047 | -1.748 | -0.6844 | Yes | ||
| 30 | EIF4G2 | 1908 8892 | 17159 | -1.893 | -0.6676 | Yes | ||
| 31 | EIF5 | 5736 | 17173 | -1.912 | -0.6452 | Yes | ||
| 32 | DICER1 | 20989 | 17314 | -2.121 | -0.6272 | Yes | ||
| 33 | SF3A2 | 19938 | 17326 | -2.138 | -0.6020 | Yes | ||
| 34 | SF3A1 | 7450 | 17384 | -2.247 | -0.5779 | Yes | ||
| 35 | EIF4B | 13279 7979 | 17392 | -2.258 | -0.5511 | Yes | ||
| 36 | DDX20 | 15213 | 17544 | -2.502 | -0.5290 | Yes | ||
| 37 | SFRS6 | 14751 | 17617 | -2.689 | -0.5005 | Yes | ||
| 38 | SIP1 | 21263 | 17619 | -2.696 | -0.4680 | Yes | ||
| 39 | FUSIP1 | 4715 16036 | 17627 | -2.708 | -0.4357 | Yes | ||
| 40 | SNRPD2 | 8412 | 17892 | -3.333 | -0.4097 | Yes | ||
| 41 | SNRPD1 | 23622 | 17897 | -3.342 | -0.3697 | Yes | ||
| 42 | EIF2B4 | 16574 | 18192 | -4.269 | -0.3340 | Yes | ||
| 43 | EIF2B5 | 1719 22822 | 18220 | -4.393 | -0.2825 | Yes | ||
| 44 | EIF2B1 | 16368 3458 | 18450 | -5.739 | -0.2256 | Yes | ||
| 45 | EIF1 | 23563 | 18457 | -5.837 | -0.1555 | Yes | ||
| 46 | EIF5A | 11345 20379 6590 | 18471 | -5.997 | -0.0839 | Yes | ||
| 47 | EIF2B3 | 16118 | 18573 | -7.596 | 0.0023 | Yes |

