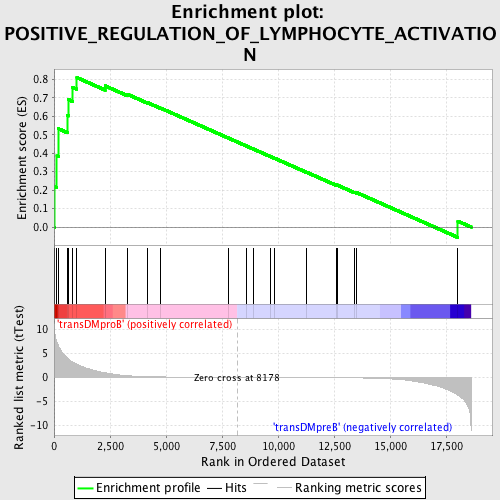
Profile of the Running ES Score & Positions of GeneSet Members on the Rank Ordered List
| Dataset | Set_04_transDMproB_versus_transDMpreB.phenotype_transDMproB_versus_transDMpreB.cls #transDMproB_versus_transDMpreB.phenotype_transDMproB_versus_transDMpreB.cls #transDMproB_versus_transDMpreB_repos |
| Phenotype | phenotype_transDMproB_versus_transDMpreB.cls#transDMproB_versus_transDMpreB_repos |
| Upregulated in class | transDMproB |
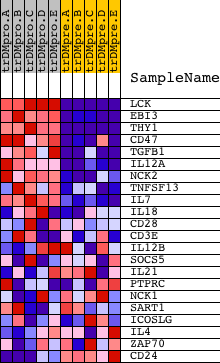
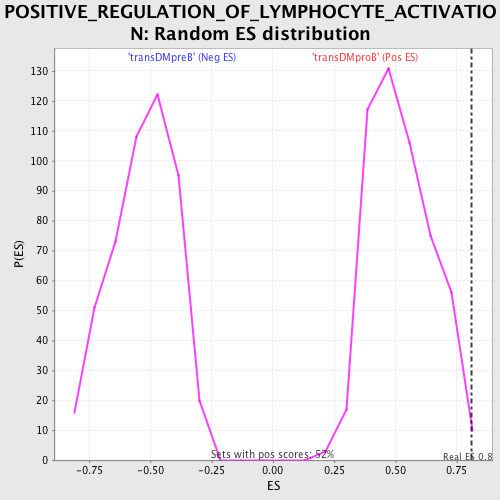
| GeneSet | POSITIVE_REGULATION_OF_LYMPHOCYTE_ACTIVATION |
| Enrichment Score (ES) | 0.81011814 |
| Normalized Enrichment Score (NES) | 1.5528148 |
| Nominal p-value | 0.0058252425 |
| FDR q-value | 0.30150023 |
| FWER p-Value | 0.953 |
| PROBE | DESCRIPTION (from dataset) | GENE SYMBOL | GENE_TITLE | RANK IN GENE LIST | RANK METRIC SCORE | RUNNING ES | CORE ENRICHMENT | |
|---|---|---|---|---|---|---|---|---|
| 1 | LCK | 15746 | 27 | 9.283 | 0.2181 | Yes | ||
| 2 | EBI3 | 23193 | 127 | 7.299 | 0.3853 | Yes | ||
| 3 | THY1 | 19481 | 199 | 6.383 | 0.5325 | Yes | ||
| 4 | CD47 | 4933 | 596 | 3.950 | 0.6046 | Yes | ||
| 5 | TGFB1 | 18332 | 647 | 3.751 | 0.6906 | Yes | ||
| 6 | IL12A | 4913 | 820 | 3.198 | 0.7570 | Yes | ||
| 7 | NCK2 | 9448 | 1018 | 2.695 | 0.8101 | Yes | ||
| 8 | TNFSF13 | 12806 | 2276 | 0.962 | 0.7653 | No | ||
| 9 | IL7 | 4921 | 3269 | 0.334 | 0.7198 | No | ||
| 10 | IL18 | 9172 | 4165 | 0.128 | 0.6747 | No | ||
| 11 | CD28 | 14239 4092 | 4745 | 0.076 | 0.6454 | No | ||
| 12 | CD3E | 8714 | 7771 | 0.006 | 0.4828 | No | ||
| 13 | IL12B | 20918 | 8591 | -0.005 | 0.4389 | No | ||
| 14 | SOCS5 | 1619 23141 | 8896 | -0.009 | 0.4228 | No | ||
| 15 | IL21 | 12241 | 9664 | -0.019 | 0.3820 | No | ||
| 16 | PTPRC | 5327 9662 | 9820 | -0.021 | 0.3741 | No | ||
| 17 | NCK1 | 9447 5152 | 11287 | -0.044 | 0.2963 | No | ||
| 18 | SART1 | 23977 | 12589 | -0.079 | 0.2282 | No | ||
| 19 | ICOSLG | 19973 | 12628 | -0.081 | 0.2281 | No | ||
| 20 | IL4 | 9174 | 13421 | -0.117 | 0.1883 | No | ||
| 21 | ZAP70 | 14271 4042 | 13513 | -0.123 | 0.1863 | No | ||
| 22 | CD24 | 8711 | 18026 | -3.725 | 0.0317 | No |