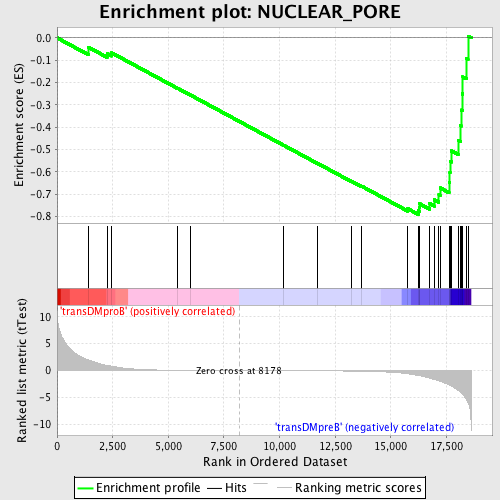
Profile of the Running ES Score & Positions of GeneSet Members on the Rank Ordered List
| Dataset | Set_04_transDMproB_versus_transDMpreB.phenotype_transDMproB_versus_transDMpreB.cls #transDMproB_versus_transDMpreB.phenotype_transDMproB_versus_transDMpreB.cls #transDMproB_versus_transDMpreB_repos |
| Phenotype | phenotype_transDMproB_versus_transDMpreB.cls#transDMproB_versus_transDMpreB_repos |
| Upregulated in class | transDMpreB |
| GeneSet | NUCLEAR_PORE |
| Enrichment Score (ES) | -0.7909069 |
| Normalized Enrichment Score (NES) | -1.6315142 |
| Nominal p-value | 0.0 |
| FDR q-value | 0.037119485 |
| FWER p-Value | 0.49 |

| PROBE | DESCRIPTION (from dataset) | GENE SYMBOL | GENE_TITLE | RANK IN GENE LIST | RANK METRIC SCORE | RUNNING ES | CORE ENRICHMENT | |
|---|---|---|---|---|---|---|---|---|
| 1 | HRB | 14208 4066 | 1411 | 1.950 | -0.0422 | No | ||
| 2 | RANGAP1 | 2180 22195 | 2246 | 0.984 | -0.0700 | No | ||
| 3 | NUP54 | 11231 11232 6516 | 2456 | 0.810 | -0.0673 | No | ||
| 4 | NUP153 | 21474 | 5412 | 0.049 | -0.2254 | No | ||
| 5 | SENP2 | 7990 | 6007 | 0.034 | -0.2568 | No | ||
| 6 | TPR | 927 4255 | 10181 | -0.026 | -0.4808 | No | ||
| 7 | NUP50 | 22403 9478 22402 2168 | 11701 | -0.053 | -0.5616 | No | ||
| 8 | IPO7 | 6130 | 13229 | -0.106 | -0.6419 | No | ||
| 9 | NUP133 | 3849 18714 | 13675 | -0.136 | -0.6635 | No | ||
| 10 | NUP98 | 17726 | 15764 | -0.613 | -0.7652 | No | ||
| 11 | KPNA3 | 21797 | 16242 | -0.961 | -0.7743 | Yes | ||
| 12 | KPNA1 | 22776 | 16276 | -0.985 | -0.7590 | Yes | ||
| 13 | NXT1 | 14814 | 16288 | -0.993 | -0.7425 | Yes | ||
| 14 | NUTF2 | 12632 7529 | 16744 | -1.423 | -0.7423 | Yes | ||
| 15 | NUP62 | 9497 | 16948 | -1.656 | -0.7246 | Yes | ||
| 16 | XPO7 | 12272 7239 | 17162 | -1.895 | -0.7033 | Yes | ||
| 17 | RANBP2 | 20019 | 17218 | -1.991 | -0.6719 | Yes | ||
| 18 | NUP88 | 20365 1316 | 17618 | -2.695 | -0.6468 | Yes | ||
| 19 | SNUPN | 12282 | 17654 | -2.754 | -0.6011 | Yes | ||
| 20 | SUMO1 | 5826 3943 10247 | 17665 | -2.792 | -0.5533 | Yes | ||
| 21 | DDX19B | 8888 | 17717 | -2.897 | -0.5060 | Yes | ||
| 22 | NUP160 | 14957 | 18027 | -3.726 | -0.4582 | Yes | ||
| 23 | AAAS | 22111 2274 | 18134 | -4.076 | -0.3935 | Yes | ||
| 24 | RAE1 | 12395 | 18159 | -4.157 | -0.3229 | Yes | ||
| 25 | NUP107 | 8337 | 18212 | -4.349 | -0.2506 | Yes | ||
| 26 | RANBP5 | 21930 | 18236 | -4.454 | -0.1749 | Yes | ||
| 27 | KPNB1 | 20274 | 18392 | -5.297 | -0.0917 | Yes | ||
| 28 | EIF5A | 11345 20379 6590 | 18471 | -5.997 | 0.0078 | Yes |

