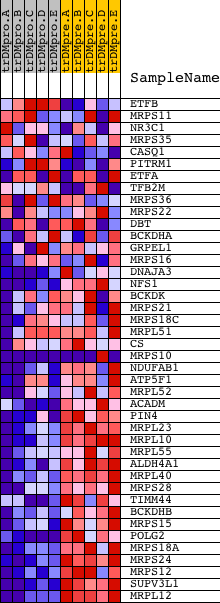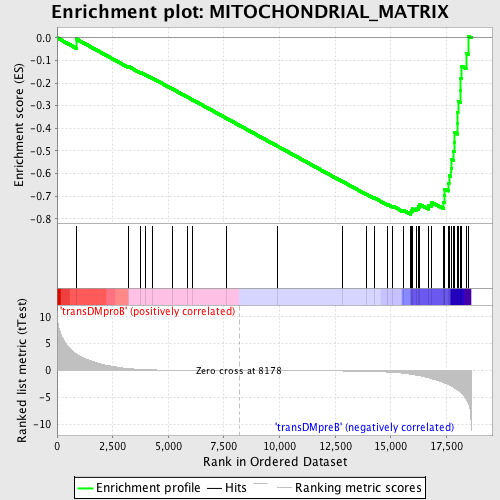
Profile of the Running ES Score & Positions of GeneSet Members on the Rank Ordered List
| Dataset | Set_04_transDMproB_versus_transDMpreB.phenotype_transDMproB_versus_transDMpreB.cls #transDMproB_versus_transDMpreB.phenotype_transDMproB_versus_transDMpreB.cls #transDMproB_versus_transDMpreB_repos |
| Phenotype | phenotype_transDMproB_versus_transDMpreB.cls#transDMproB_versus_transDMpreB_repos |
| Upregulated in class | transDMpreB |
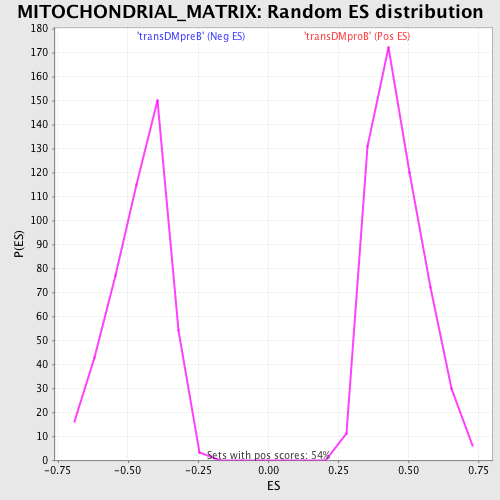
| GeneSet | MITOCHONDRIAL_MATRIX |
| Enrichment Score (ES) | -0.7806228 |
| Normalized Enrichment Score (NES) | -1.6968156 |
| Nominal p-value | 0.0 |
| FDR q-value | 0.023931697 |
| FWER p-Value | 0.143 |
| PROBE | DESCRIPTION (from dataset) | GENE SYMBOL | GENE_TITLE | RANK IN GENE LIST | RANK METRIC SCORE | RUNNING ES | CORE ENRICHMENT | |
|---|---|---|---|---|---|---|---|---|
| 1 | ETFB | 18279 | 858 | 3.110 | -0.0051 | No | ||
| 2 | MRPS11 | 12621 3150 | 3214 | 0.357 | -0.1272 | No | ||
| 3 | NR3C1 | 9043 | 3766 | 0.197 | -0.1543 | No | ||
| 4 | MRPS35 | 17237 1068 | 3991 | 0.154 | -0.1643 | No | ||
| 5 | CASQ1 | 13752 8695 | 4301 | 0.111 | -0.1795 | No | ||
| 6 | PITRM1 | 21710 | 5178 | 0.057 | -0.2259 | No | ||
| 7 | ETFA | 4292 8495 3155 | 5876 | 0.037 | -0.2629 | No | ||
| 8 | TFB2M | 4024 9092 4083 | 6107 | 0.032 | -0.2749 | No | ||
| 9 | MRPS36 | 7257 | 7611 | 0.008 | -0.3557 | No | ||
| 10 | MRPS22 | 19031 | 9911 | -0.022 | -0.4792 | No | ||
| 11 | DBT | 1770 4599 | 12814 | -0.087 | -0.6343 | No | ||
| 12 | BCKDHA | 17925 | 13915 | -0.155 | -0.6914 | No | ||
| 13 | GRPEL1 | 16863 | 14248 | -0.191 | -0.7068 | No | ||
| 14 | MRPS16 | 12311 | 14866 | -0.287 | -0.7362 | No | ||
| 15 | DNAJA3 | 1732 13518 | 15085 | -0.345 | -0.7434 | No | ||
| 16 | NFS1 | 2903 14377 | 15562 | -0.512 | -0.7623 | No | ||
| 17 | BCKDK | 18061 1391 | 15904 | -0.691 | -0.7715 | Yes | ||
| 18 | MRPS21 | 12323 | 15917 | -0.704 | -0.7629 | Yes | ||
| 19 | MRPS18C | 12728 | 15975 | -0.744 | -0.7561 | Yes | ||
| 20 | MRPL51 | 12361 7301 | 16140 | -0.877 | -0.7534 | Yes | ||
| 21 | CS | 19839 | 16237 | -0.958 | -0.7459 | Yes | ||
| 22 | MRPS10 | 7229 12261 23212 | 16306 | -0.998 | -0.7364 | Yes | ||
| 23 | NDUFAB1 | 7667 | 16683 | -1.340 | -0.7389 | Yes | ||
| 24 | ATP5F1 | 15212 | 16834 | -1.531 | -0.7268 | Yes | ||
| 25 | MRPL52 | 22019 | 17382 | -2.244 | -0.7266 | Yes | ||
| 26 | ACADM | 15133 1800 | 17408 | -2.289 | -0.6978 | Yes | ||
| 27 | PIN4 | 12817 | 17424 | -2.304 | -0.6682 | Yes | ||
| 28 | MRPL23 | 9738 | 17587 | -2.604 | -0.6425 | Yes | ||
| 29 | MRPL10 | 20681 | 17616 | -2.689 | -0.6086 | Yes | ||
| 30 | MRPL55 | 20864 | 17704 | -2.876 | -0.5753 | Yes | ||
| 31 | ALDH4A1 | 16011 | 17729 | -2.920 | -0.5381 | Yes | ||
| 32 | MRPL40 | 22641 | 17822 | -3.132 | -0.5017 | Yes | ||
| 33 | MRPS28 | 15377 | 17868 | -3.242 | -0.4613 | Yes | ||
| 34 | TIMM44 | 3858 18941 | 17877 | -3.270 | -0.4186 | Yes | ||
| 35 | BCKDHB | 19365 | 18002 | -3.653 | -0.3771 | Yes | ||
| 36 | MRPS15 | 2442 12345 | 18006 | -3.673 | -0.3287 | Yes | ||
| 37 | POLG2 | 20180 | 18020 | -3.703 | -0.2806 | Yes | ||
| 38 | MRPS18A | 23222 | 18138 | -4.099 | -0.2328 | Yes | ||
| 39 | MRPS24 | 12262 | 18147 | -4.124 | -0.1788 | Yes | ||
| 40 | MRPS12 | 17907 6273 | 18170 | -4.188 | -0.1247 | Yes | ||
| 41 | SUPV3L1 | 11677 | 18382 | -5.212 | -0.0673 | Yes | ||
| 42 | MRPL12 | 12090 | 18479 | -6.051 | 0.0074 | Yes |