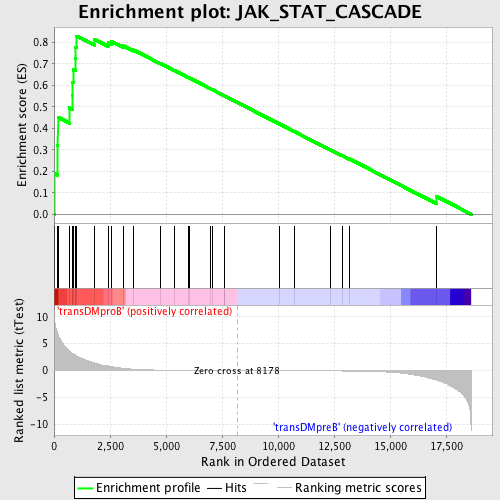
Profile of the Running ES Score & Positions of GeneSet Members on the Rank Ordered List
| Dataset | Set_04_transDMproB_versus_transDMpreB.phenotype_transDMproB_versus_transDMpreB.cls #transDMproB_versus_transDMpreB.phenotype_transDMproB_versus_transDMpreB.cls #transDMproB_versus_transDMpreB_repos |
| Phenotype | phenotype_transDMproB_versus_transDMpreB.cls#transDMproB_versus_transDMpreB_repos |
| Upregulated in class | transDMproB |
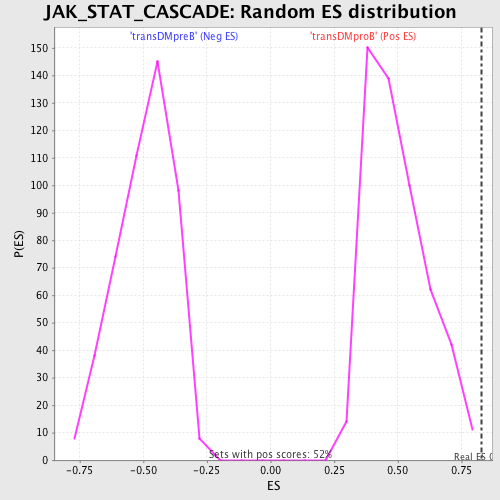
| GeneSet | JAK_STAT_CASCADE |
| Enrichment Score (ES) | 0.829027 |
| Normalized Enrichment Score (NES) | 1.6685342 |
| Nominal p-value | 0.0019305019 |
| FDR q-value | 0.13878772 |
| FWER p-Value | 0.219 |
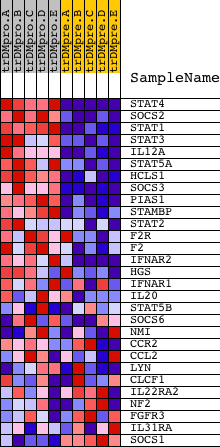
| PROBE | DESCRIPTION (from dataset) | GENE SYMBOL | GENE_TITLE | RANK IN GENE LIST | RANK METRIC SCORE | RUNNING ES | CORE ENRICHMENT | |
|---|---|---|---|---|---|---|---|---|
| 1 | STAT4 | 14251 9907 | 21 | 9.674 | 0.1888 | Yes | ||
| 2 | SOCS2 | 5694 | 148 | 7.026 | 0.3200 | Yes | ||
| 3 | STAT1 | 3936 5524 | 173 | 6.741 | 0.4511 | Yes | ||
| 4 | STAT3 | 5525 9906 | 681 | 3.642 | 0.4953 | Yes | ||
| 5 | IL12A | 4913 | 820 | 3.198 | 0.5507 | Yes | ||
| 6 | STAT5A | 20664 | 824 | 3.180 | 0.6130 | Yes | ||
| 7 | HCLS1 | 22770 | 850 | 3.123 | 0.6729 | Yes | ||
| 8 | SOCS3 | 20131 | 954 | 2.853 | 0.7234 | Yes | ||
| 9 | PIAS1 | 7126 | 967 | 2.829 | 0.7783 | Yes | ||
| 10 | STAMBP | 17097 | 1012 | 2.702 | 0.8290 | Yes | ||
| 11 | STAT2 | 19840 | 1800 | 1.421 | 0.8146 | No | ||
| 12 | F2R | 21386 | 2408 | 0.848 | 0.7986 | No | ||
| 13 | F2 | 14524 | 2573 | 0.720 | 0.8039 | No | ||
| 14 | IFNAR2 | 22705 1699 | 3103 | 0.407 | 0.7834 | No | ||
| 15 | HGS | 20568 | 3546 | 0.246 | 0.7645 | No | ||
| 16 | IFNAR1 | 22703 | 4756 | 0.075 | 0.7009 | No | ||
| 17 | IL20 | 13840 | 5386 | 0.050 | 0.6681 | No | ||
| 18 | STAT5B | 20222 | 5983 | 0.035 | 0.6367 | No | ||
| 19 | SOCS6 | 12042 7044 | 6057 | 0.033 | 0.6334 | No | ||
| 20 | NMI | 14590 | 6979 | 0.017 | 0.5842 | No | ||
| 21 | CCR2 | 19250 | 7053 | 0.016 | 0.5806 | No | ||
| 22 | CCL2 | 9788 | 7586 | 0.009 | 0.5521 | No | ||
| 23 | LYN | 16281 | 7605 | 0.008 | 0.5513 | No | ||
| 24 | CLCF1 | 12160 3742 | 10051 | -0.024 | 0.4202 | No | ||
| 25 | IL22RA2 | 20082 | 10739 | -0.034 | 0.3840 | No | ||
| 26 | NF2 | 1222 5166 | 12334 | -0.070 | 0.2996 | No | ||
| 27 | FGFR3 | 8969 3566 | 12854 | -0.089 | 0.2734 | No | ||
| 28 | IL31RA | 21347 | 13174 | -0.104 | 0.2583 | No | ||
| 29 | SOCS1 | 4522 | 17053 | -1.754 | 0.0841 | No |