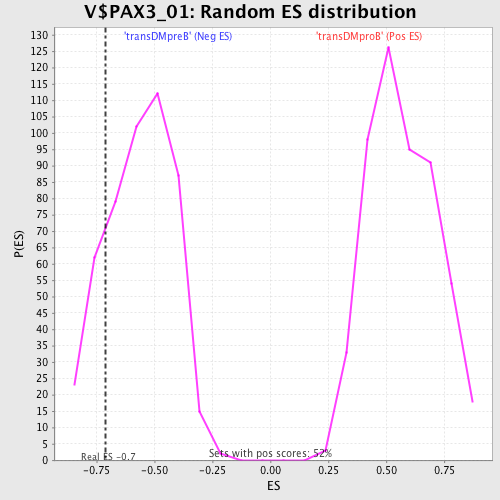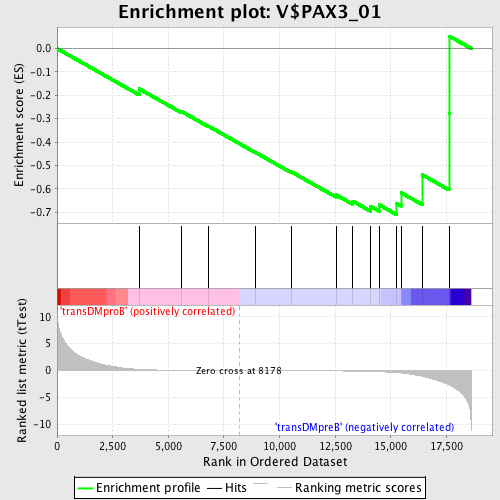
Profile of the Running ES Score & Positions of GeneSet Members on the Rank Ordered List
| Dataset | Set_04_transDMproB_versus_transDMpreB.phenotype_transDMproB_versus_transDMpreB.cls #transDMproB_versus_transDMpreB.phenotype_transDMproB_versus_transDMpreB.cls #transDMproB_versus_transDMpreB_repos |
| Phenotype | phenotype_transDMproB_versus_transDMpreB.cls#transDMproB_versus_transDMpreB_repos |
| Upregulated in class | transDMpreB |
| GeneSet | V$PAX3_01 |
| Enrichment Score (ES) | -0.7095013 |
| Normalized Enrichment Score (NES) | -1.2631261 |
| Nominal p-value | 0.17842324 |
| FDR q-value | 0.52851737 |
| FWER p-Value | 1.0 |
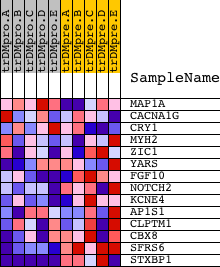
| PROBE | DESCRIPTION (from dataset) | GENE SYMBOL | GENE_TITLE | RANK IN GENE LIST | RANK METRIC SCORE | RUNNING ES | CORE ENRICHMENT | |
|---|---|---|---|---|---|---|---|---|
| 1 | MAP1A | 5124 | 3689 | 0.214 | -0.1722 | No | ||
| 2 | CACNA1G | 1237 940 20292 | 5593 | 0.044 | -0.2691 | No | ||
| 3 | CRY1 | 19662 | 6812 | 0.019 | -0.3322 | No | ||
| 4 | MYH2 | 20838 | 8935 | -0.010 | -0.4451 | No | ||
| 5 | ZIC1 | 19040 | 10540 | -0.031 | -0.5276 | No | ||
| 6 | YARS | 16071 | 12538 | -0.078 | -0.6254 | No | ||
| 7 | FGF10 | 4719 8962 | 13285 | -0.109 | -0.6523 | No | ||
| 8 | NOTCH2 | 15485 | 14087 | -0.172 | -0.6743 | Yes | ||
| 9 | KCNE4 | 12196 | 14483 | -0.222 | -0.6685 | Yes | ||
| 10 | AP1S1 | 3500 3453 16335 | 15247 | -0.392 | -0.6617 | Yes | ||
| 11 | CLPTM1 | 17940 | 15463 | -0.466 | -0.6165 | Yes | ||
| 12 | CBX8 | 11401 | 16414 | -1.049 | -0.5397 | Yes | ||
| 13 | SFRS6 | 14751 | 17617 | -2.689 | -0.2766 | Yes | ||
| 14 | STXBP1 | 2818 9930 | 17628 | -2.709 | 0.0531 | Yes |