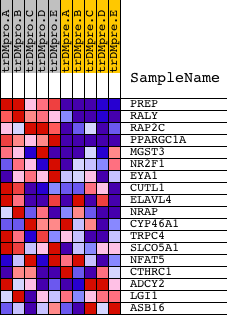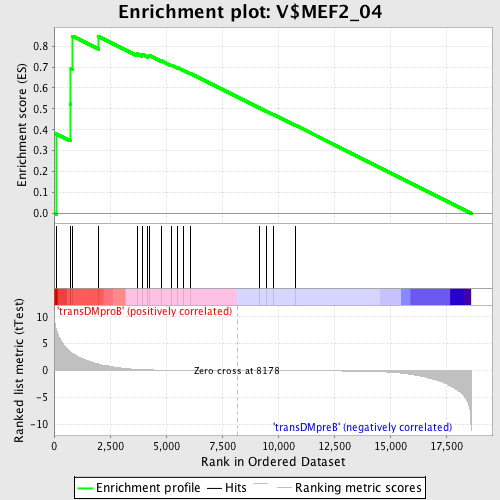
Profile of the Running ES Score & Positions of GeneSet Members on the Rank Ordered List
| Dataset | Set_04_transDMproB_versus_transDMpreB.phenotype_transDMproB_versus_transDMpreB.cls #transDMproB_versus_transDMpreB.phenotype_transDMproB_versus_transDMpreB.cls #transDMproB_versus_transDMpreB_repos |
| Phenotype | phenotype_transDMproB_versus_transDMpreB.cls#transDMproB_versus_transDMpreB_repos |
| Upregulated in class | transDMproB |
| GeneSet | V$MEF2_04 |
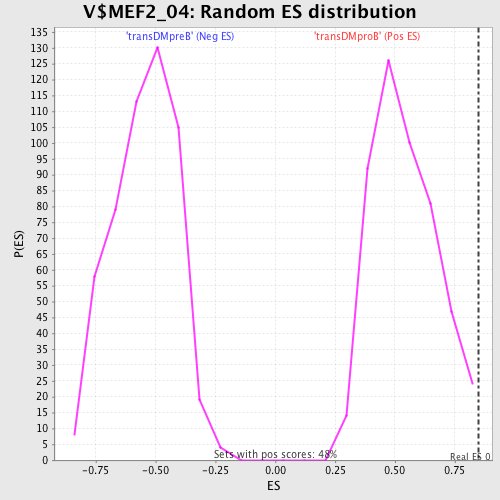
| Enrichment Score (ES) | 0.84781164 |
| Normalized Enrichment Score (NES) | 1.5648377 |
| Nominal p-value | 0.008264462 |
| FDR q-value | 0.05020086 |
| FWER p-Value | 0.468 |
| PROBE | DESCRIPTION (from dataset) | GENE SYMBOL | GENE_TITLE | RANK IN GENE LIST | RANK METRIC SCORE | RUNNING ES | CORE ENRICHMENT | |
|---|---|---|---|---|---|---|---|---|
| 1 | PREP | 20035 | 101 | 7.625 | 0.3801 | Yes | ||
| 2 | RALY | 2718 9690 | 719 | 3.486 | 0.5232 | Yes | ||
| 3 | RAP2C | 24156 | 751 | 3.382 | 0.6925 | Yes | ||
| 4 | PPARGC1A | 16533 | 835 | 3.159 | 0.8478 | Yes | ||
| 5 | MGST3 | 13771 12349 | 1991 | 1.179 | 0.8453 | No | ||
| 6 | NR2F1 | 7015 21401 | 3702 | 0.210 | 0.7640 | No | ||
| 7 | EYA1 | 4695 4061 | 3923 | 0.165 | 0.7606 | No | ||
| 8 | CUTL1 | 3507 3480 8820 3609 4577 | 4190 | 0.124 | 0.7525 | No | ||
| 9 | ELAVL4 | 15805 4889 9137 | 4250 | 0.116 | 0.7552 | No | ||
| 10 | NRAP | 23642 | 4786 | 0.073 | 0.7302 | No | ||
| 11 | CYP46A1 | 21158 | 5245 | 0.055 | 0.7083 | No | ||
| 12 | TRPC4 | 15593 | 5527 | 0.046 | 0.6955 | No | ||
| 13 | SLCO5A1 | 6286 | 5756 | 0.039 | 0.6853 | No | ||
| 14 | NFAT5 | 3921 7037 12036 | 6081 | 0.033 | 0.6695 | No | ||
| 15 | CTHRC1 | 22485 | 9157 | -0.012 | 0.5048 | No | ||
| 16 | ADCY2 | 21412 | 9459 | -0.016 | 0.4894 | No | ||
| 17 | LGI1 | 23867 | 9800 | -0.020 | 0.4722 | No | ||
| 18 | ASB16 | 20644 | 10776 | -0.035 | 0.4215 | No |