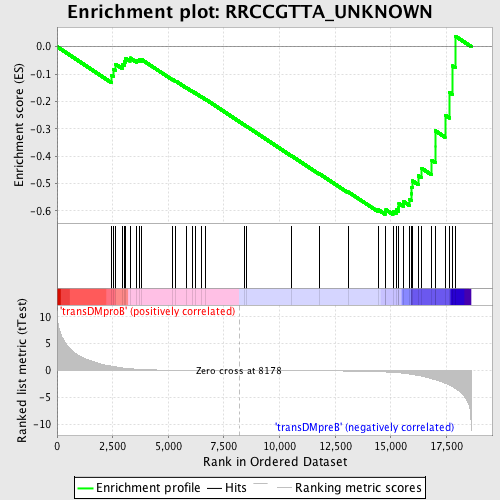
Profile of the Running ES Score & Positions of GeneSet Members on the Rank Ordered List
| Dataset | Set_04_transDMproB_versus_transDMpreB.phenotype_transDMproB_versus_transDMpreB.cls #transDMproB_versus_transDMpreB.phenotype_transDMproB_versus_transDMpreB.cls #transDMproB_versus_transDMpreB_repos |
| Phenotype | phenotype_transDMproB_versus_transDMpreB.cls#transDMproB_versus_transDMpreB_repos |
| Upregulated in class | transDMpreB |
| GeneSet | RRCCGTTA_UNKNOWN |
| Enrichment Score (ES) | -0.61313295 |
| Normalized Enrichment Score (NES) | -1.3315288 |
| Nominal p-value | 0.066815145 |
| FDR q-value | 0.49472108 |
| FWER p-Value | 1.0 |
| PROBE | DESCRIPTION (from dataset) | GENE SYMBOL | GENE_TITLE | RANK IN GENE LIST | RANK METRIC SCORE | RUNNING ES | CORE ENRICHMENT | |
|---|---|---|---|---|---|---|---|---|
| 1 | VCP | 11254 | 2452 | 0.813 | -0.1040 | No | ||
| 2 | STK16 | 14216 | 2528 | 0.757 | -0.0820 | No | ||
| 3 | HNRPC | 9102 4859 | 2620 | 0.684 | -0.0634 | No | ||
| 4 | ILF3 | 3110 3030 9176 | 2949 | 0.476 | -0.0647 | No | ||
| 5 | NFIA | 16172 5170 | 3020 | 0.446 | -0.0531 | No | ||
| 6 | MYC | 22465 9435 | 3081 | 0.419 | -0.0419 | No | ||
| 7 | PHTF1 | 15469 | 3278 | 0.330 | -0.0411 | No | ||
| 8 | BAP1 | 22057 | 3587 | 0.236 | -0.0496 | No | ||
| 9 | ATF7IP | 12028 13038 | 3684 | 0.215 | -0.0473 | No | ||
| 10 | MYH10 | 8077 | 3781 | 0.195 | -0.0458 | No | ||
| 11 | CBLL1 | 4188 | 5192 | 0.057 | -0.1198 | No | ||
| 12 | LUC7L2 | 5313 5312 | 5338 | 0.052 | -0.1258 | No | ||
| 13 | CLDN3 | 16680 | 5794 | 0.039 | -0.1490 | No | ||
| 14 | TRIM2 | 13485 8157 | 6064 | 0.033 | -0.1623 | No | ||
| 15 | CYP1B1 | 4581 | 6202 | 0.030 | -0.1686 | No | ||
| 16 | EZH2 | 1092 17163 | 6473 | 0.025 | -0.1823 | No | ||
| 17 | NCAM1 | 5149 | 6688 | 0.022 | -0.1931 | No | ||
| 18 | SMARCA5 | 8215 | 8411 | -0.003 | -0.2857 | No | ||
| 19 | SON | 5473 1657 1684 | 8509 | -0.004 | -0.2908 | No | ||
| 20 | NRK | 6559 | 10547 | -0.031 | -0.3994 | No | ||
| 21 | WEE1 | 18127 | 11778 | -0.055 | -0.4637 | No | ||
| 22 | VIM | 80 | 13087 | -0.099 | -0.5307 | No | ||
| 23 | DIABLO | 16375 | 14436 | -0.215 | -0.5959 | No | ||
| 24 | HNRPR | 13196 7909 2500 | 14743 | -0.263 | -0.6033 | Yes | ||
| 25 | MAZ | 1327 17623 | 14779 | -0.268 | -0.5960 | Yes | ||
| 26 | SLC25A14 | 24344 | 15099 | -0.348 | -0.6012 | Yes | ||
| 27 | SFRS1 | 8492 | 15244 | -0.391 | -0.5954 | Yes | ||
| 28 | PVRL3 | 1674 22579 1675 | 15352 | -0.427 | -0.5865 | Yes | ||
| 29 | TAGLN2 | 14043 | 15362 | -0.428 | -0.5723 | Yes | ||
| 30 | PHF7 | 21890 | 15560 | -0.511 | -0.5653 | Yes | ||
| 31 | UBE2S | 17979 | 15841 | -0.651 | -0.5580 | Yes | ||
| 32 | TIMM9 | 19686 | 15923 | -0.710 | -0.5379 | Yes | ||
| 33 | STC2 | 5526 | 15932 | -0.716 | -0.5137 | Yes | ||
| 34 | EGR3 | 4656 | 15973 | -0.744 | -0.4903 | Yes | ||
| 35 | CSTF1 | 12515 | 16233 | -0.954 | -0.4714 | Yes | ||
| 36 | AP1M1 | 18571 | 16372 | -1.027 | -0.4435 | Yes | ||
| 37 | HSPC171 | 18494 | 16842 | -1.538 | -0.4158 | Yes | ||
| 38 | BANF1 | 6216 10706 3760 | 17004 | -1.702 | -0.3659 | Yes | ||
| 39 | NMT1 | 20638 | 17005 | -1.703 | -0.3073 | Yes | ||
| 40 | ADD3 | 23812 3694 | 17439 | -2.337 | -0.2502 | Yes | ||
| 41 | SUV39H1 | 24194 | 17637 | -2.723 | -0.1672 | Yes | ||
| 42 | GART | 22543 1754 | 17782 | -3.046 | -0.0701 | Yes | ||
| 43 | SNRPD1 | 23622 | 17897 | -3.342 | 0.0387 | Yes |

