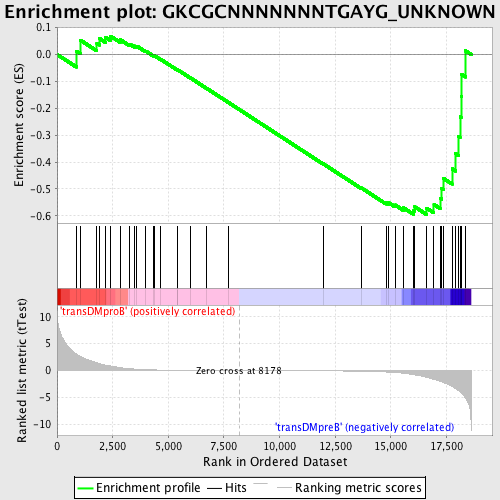
Profile of the Running ES Score & Positions of GeneSet Members on the Rank Ordered List
| Dataset | Set_04_transDMproB_versus_transDMpreB.phenotype_transDMproB_versus_transDMpreB.cls #transDMproB_versus_transDMpreB.phenotype_transDMproB_versus_transDMpreB.cls #transDMproB_versus_transDMpreB_repos |
| Phenotype | phenotype_transDMproB_versus_transDMpreB.cls#transDMproB_versus_transDMpreB_repos |
| Upregulated in class | transDMpreB |
| GeneSet | GKCGCNNNNNNNTGAYG_UNKNOWN |
| Enrichment Score (ES) | -0.59493655 |
| Normalized Enrichment Score (NES) | -1.2676415 |
| Nominal p-value | 0.11506276 |
| FDR q-value | 0.62468094 |
| FWER p-Value | 1.0 |
| PROBE | DESCRIPTION (from dataset) | GENE SYMBOL | GENE_TITLE | RANK IN GENE LIST | RANK METRIC SCORE | RUNNING ES | CORE ENRICHMENT | |
|---|---|---|---|---|---|---|---|---|
| 1 | DHRS1 | 21819 | 867 | 3.085 | 0.0122 | No | ||
| 2 | ORMDL3 | 12386 | 1037 | 2.654 | 0.0538 | No | ||
| 3 | GPAM | 4795 | 1787 | 1.439 | 0.0410 | No | ||
| 4 | RNF7 | 19036 | 1897 | 1.295 | 0.0599 | No | ||
| 5 | PSMB2 | 2324 16078 | 2171 | 1.011 | 0.0645 | No | ||
| 6 | MRPL49 | 3696 9472 23990 | 2401 | 0.851 | 0.0684 | No | ||
| 7 | RCE1 | 23965 | 2834 | 0.536 | 0.0554 | No | ||
| 8 | DNAJB11 | 22813 | 3266 | 0.335 | 0.0386 | No | ||
| 9 | ALS2CR2 | 5966 969 | 3487 | 0.264 | 0.0318 | No | ||
| 10 | BAP1 | 22057 | 3587 | 0.236 | 0.0310 | No | ||
| 11 | LCMT1 | 18088 1094 | 3980 | 0.157 | 0.0129 | No | ||
| 12 | UXT | 5837 10267 | 4331 | 0.107 | -0.0039 | No | ||
| 13 | GTF3C2 | 7749 | 4384 | 0.102 | -0.0048 | No | ||
| 14 | ANAPC10 | 7595 12760 7596 | 4664 | 0.081 | -0.0183 | No | ||
| 15 | NUP153 | 21474 | 5412 | 0.049 | -0.0575 | No | ||
| 16 | FAU | 8954 | 5429 | 0.049 | -0.0575 | No | ||
| 17 | SENP2 | 7990 | 6007 | 0.034 | -0.0879 | No | ||
| 18 | ABCE1 | 6270 | 6698 | 0.021 | -0.1246 | No | ||
| 19 | RNPS1 | 9730 23361 | 7695 | 0.007 | -0.1781 | No | ||
| 20 | MFN2 | 15678 2417 | 11958 | -0.060 | -0.4064 | No | ||
| 21 | NUP133 | 3849 18714 | 13675 | -0.136 | -0.4961 | No | ||
| 22 | BCL2L2 | 8653 4441 | 14791 | -0.271 | -0.5510 | No | ||
| 23 | BRMS1 | 8403 | 14913 | -0.297 | -0.5518 | No | ||
| 24 | UBE4A | 4704 | 15190 | -0.374 | -0.5595 | No | ||
| 25 | PHF7 | 21890 | 15560 | -0.511 | -0.5696 | No | ||
| 26 | RNF141 | 12478 7392 | 16031 | -0.788 | -0.5799 | Yes | ||
| 27 | NFX1 | 2475 | 16077 | -0.824 | -0.5666 | Yes | ||
| 28 | RFC1 | 16527 | 16602 | -1.243 | -0.5710 | Yes | ||
| 29 | ACO2 | 8527 | 16939 | -1.637 | -0.5579 | Yes | ||
| 30 | RANBP2 | 20019 | 17218 | -1.991 | -0.5348 | Yes | ||
| 31 | NEK1 | 18610 | 17282 | -2.089 | -0.4983 | Yes | ||
| 32 | CNOT7 | 3787 9600 | 17357 | -2.189 | -0.4605 | Yes | ||
| 33 | PHF5A | 22194 | 17755 | -2.970 | -0.4251 | Yes | ||
| 34 | QTRTD1 | 22590 | 17913 | -3.387 | -0.3689 | Yes | ||
| 35 | NUPL2 | 6072 | 18049 | -3.784 | -0.3039 | Yes | ||
| 36 | PINX1 | 21986 | 18115 | -3.964 | -0.2317 | Yes | ||
| 37 | PSME3 | 20657 | 18163 | -4.167 | -0.1546 | Yes | ||
| 38 | NUP155 | 2298 5027 | 18189 | -4.257 | -0.0747 | Yes | ||
| 39 | COQ7 | 17664 | 18360 | -5.110 | 0.0138 | Yes |

