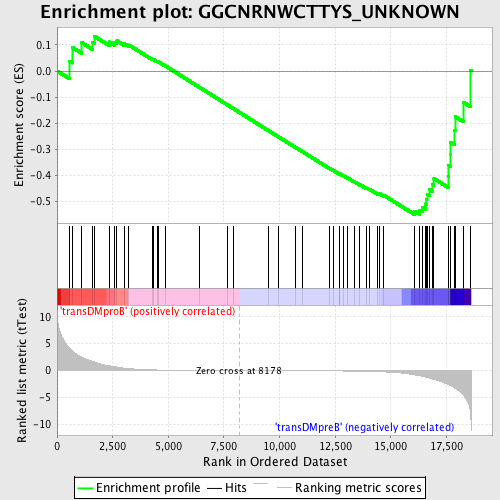
Profile of the Running ES Score & Positions of GeneSet Members on the Rank Ordered List
| Dataset | Set_04_transDMproB_versus_transDMpreB.phenotype_transDMproB_versus_transDMpreB.cls #transDMproB_versus_transDMpreB.phenotype_transDMproB_versus_transDMpreB.cls #transDMproB_versus_transDMpreB_repos |
| Phenotype | phenotype_transDMproB_versus_transDMpreB.cls#transDMproB_versus_transDMpreB_repos |
| Upregulated in class | transDMpreB |
| GeneSet | GGCNRNWCTTYS_UNKNOWN |
| Enrichment Score (ES) | -0.550708 |
| Normalized Enrichment Score (NES) | -1.2569245 |
| Nominal p-value | 0.11158799 |
| FDR q-value | 0.5254732 |
| FWER p-Value | 1.0 |
| PROBE | DESCRIPTION (from dataset) | GENE SYMBOL | GENE_TITLE | RANK IN GENE LIST | RANK METRIC SCORE | RUNNING ES | CORE ENRICHMENT | |
|---|---|---|---|---|---|---|---|---|
| 1 | ISG20 | 18210 | 565 | 4.119 | 0.0376 | No | ||
| 2 | UTX | 10266 2574 | 695 | 3.598 | 0.0901 | No | ||
| 3 | SRP14 | 9894 | 1107 | 2.489 | 0.1091 | No | ||
| 4 | NDUFS4 | 9452 5157 3173 | 1595 | 1.694 | 0.1109 | No | ||
| 5 | NEDD1 | 19643 | 1664 | 1.614 | 0.1339 | No | ||
| 6 | PCYT1A | 4572 | 2351 | 0.882 | 0.1115 | No | ||
| 7 | TBC1D17 | 6121 | 2580 | 0.715 | 0.1111 | No | ||
| 8 | EIF3S6IP | 22427 2301 | 2690 | 0.632 | 0.1156 | No | ||
| 9 | HOXA9 | 17147 9109 1024 | 3024 | 0.446 | 0.1051 | No | ||
| 10 | ATP6V1E1 | 4423 | 3229 | 0.348 | 0.0998 | No | ||
| 11 | USP9X | 10264 10265 5834 | 4281 | 0.112 | 0.0451 | No | ||
| 12 | GBA2 | 15898 | 4318 | 0.109 | 0.0449 | No | ||
| 13 | ZBTB3 | 23941 | 4501 | 0.092 | 0.0366 | No | ||
| 14 | DNAJA1 | 4878 16242 2345 | 4541 | 0.089 | 0.0360 | No | ||
| 15 | HCCS | 9079 4842 | 4892 | 0.068 | 0.0183 | No | ||
| 16 | RNF13 | 6271 | 6393 | 0.026 | -0.0621 | No | ||
| 17 | PAFAH1B2 | 5221 9525 | 7651 | 0.008 | -0.1297 | No | ||
| 18 | RPE | 14232 | 7944 | 0.003 | -0.1453 | No | ||
| 19 | NR3C2 | 18562 13798 | 9491 | -0.016 | -0.2283 | No | ||
| 20 | RPS6KA3 | 8490 | 9929 | -0.022 | -0.2515 | No | ||
| 21 | XLKD1 | 17675 | 10700 | -0.034 | -0.2924 | No | ||
| 22 | MAPK8IP3 | 11402 23080 | 11012 | -0.039 | -0.3085 | No | ||
| 23 | UBXD1 | 12370 1516 | 12253 | -0.068 | -0.3742 | No | ||
| 24 | PIGN | 13865 | 12408 | -0.073 | -0.3813 | No | ||
| 25 | AQP3 | 15915 | 12688 | -0.083 | -0.3950 | No | ||
| 26 | USH1C | 1471 17821 | 12700 | -0.083 | -0.3942 | No | ||
| 27 | FGFR3 | 8969 3566 | 12854 | -0.089 | -0.4010 | No | ||
| 28 | SP2 | 8130 | 13039 | -0.097 | -0.4093 | No | ||
| 29 | DNAJA2 | 12133 18806 | 13355 | -0.112 | -0.4244 | No | ||
| 30 | ELMO1 | 3275 8939 3202 3271 3254 3235 3164 3175 3274 3188 3293 3214 3218 3239 | 13606 | -0.130 | -0.4357 | No | ||
| 31 | GABARAPL2 | 8211 13552 | 13924 | -0.156 | -0.4502 | No | ||
| 32 | ARFIP2 | 1226 17702 | 14041 | -0.169 | -0.4536 | No | ||
| 33 | CANX | 4474 | 14411 | -0.212 | -0.4700 | No | ||
| 34 | CUGBP1 | 2805 8819 4576 2924 | 14499 | -0.225 | -0.4710 | No | ||
| 35 | RPL41 | 12611 | 14670 | -0.251 | -0.4760 | No | ||
| 36 | RPL18A | 13358 | 16058 | -0.801 | -0.5375 | Yes | ||
| 37 | XYLT2 | 20288 | 16296 | -0.996 | -0.5338 | Yes | ||
| 38 | ARFGAP1 | 14705 2854 | 16416 | -1.052 | -0.5228 | Yes | ||
| 39 | FXC1 | 8988 4043 | 16555 | -1.203 | -0.5104 | Yes | ||
| 40 | GLTSCR2 | 12639 | 16598 | -1.240 | -0.4921 | Yes | ||
| 41 | DHX30 | 18989 | 16628 | -1.276 | -0.4726 | Yes | ||
| 42 | AKT1S1 | 12557 | 16751 | -1.438 | -0.4554 | Yes | ||
| 43 | OSR1 | 18971 | 16865 | -1.564 | -0.4357 | Yes | ||
| 44 | PIP5K2B | 20269 1254 | 16937 | -1.636 | -0.4125 | Yes | ||
| 45 | GNPAT | 18420 | 17576 | -2.579 | -0.4042 | Yes | ||
| 46 | RAB8A | 9380 5091 | 17605 | -2.666 | -0.3617 | Yes | ||
| 47 | SMAD6 | 19083 | 17676 | -2.808 | -0.3191 | Yes | ||
| 48 | CBLB | 5531 22734 | 17679 | -2.815 | -0.2727 | Yes | ||
| 49 | DDX24 | 2084 20995 | 17870 | -3.254 | -0.2291 | Yes | ||
| 50 | SNRPD2 | 8412 | 17892 | -3.333 | -0.1752 | Yes | ||
| 51 | ADSL | 4358 | 18263 | -4.560 | -0.1198 | Yes | ||
| 52 | EIF4A1 | 8889 23719 | 18595 | -8.397 | 0.0011 | Yes |

