Profile of the Running ES Score & Positions of GeneSet Members on the Rank Ordered List
| Dataset | Set_04_transDMproB_versus_transDMpreB.phenotype_transDMproB_versus_transDMpreB.cls #transDMproB_versus_transDMpreB.phenotype_transDMproB_versus_transDMpreB.cls #transDMproB_versus_transDMpreB_repos |
| Phenotype | phenotype_transDMproB_versus_transDMpreB.cls#transDMproB_versus_transDMpreB_repos |
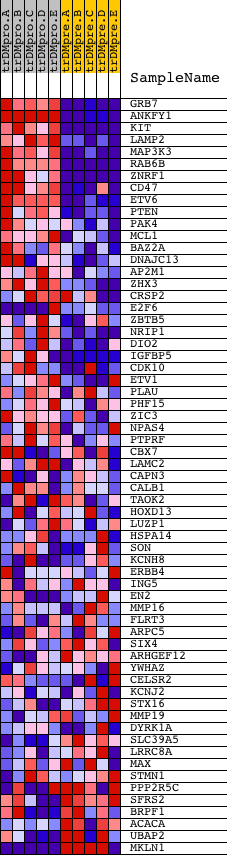
| Upregulated in class | transDMproB |
| GeneSet | GGCCAGT,MIR-193A,MIR-193B |
| Enrichment Score (ES) | 0.6897881 |
| Normalized Enrichment Score (NES) | 1.600485 |
| Nominal p-value | 0.0017636684 |
| FDR q-value | 0.059058942 |
| FWER p-Value | 0.274 |
| PROBE | DESCRIPTION (from dataset) | GENE SYMBOL | GENE_TITLE | RANK IN GENE LIST | RANK METRIC SCORE | RUNNING ES | CORE ENRICHMENT | |
|---|---|---|---|---|---|---|---|---|
| 1 | GRB7 | 20673 | 22 | 9.600 | 0.1164 | Yes | ||
| 2 | ANKFY1 | 1405 4386 | 236 | 6.055 | 0.1792 | Yes | ||
| 3 | KIT | 16823 | 251 | 5.987 | 0.2518 | Yes | ||
| 4 | LAMP2 | 9267 2653 | 252 | 5.962 | 0.3248 | Yes | ||
| 5 | MAP3K3 | 20626 | 266 | 5.885 | 0.3962 | Yes | ||
| 6 | RAB6B | 11289 | 321 | 5.467 | 0.4603 | Yes | ||
| 7 | ZNRF1 | 9306 | 504 | 4.399 | 0.5044 | Yes | ||
| 8 | CD47 | 4933 | 596 | 3.950 | 0.5479 | Yes | ||
| 9 | ETV6 | 17264 | 654 | 3.722 | 0.5904 | Yes | ||
| 10 | PTEN | 5305 | 661 | 3.694 | 0.6354 | Yes | ||
| 11 | PAK4 | 17909 | 1291 | 2.157 | 0.6279 | Yes | ||
| 12 | MCL1 | 15502 | 1299 | 2.143 | 0.6538 | Yes | ||
| 13 | BAZ2A | 4371 | 1422 | 1.937 | 0.6709 | Yes | ||
| 14 | DNAJC13 | 6177 | 1696 | 1.568 | 0.6754 | Yes | ||
| 15 | AP2M1 | 8603 | 1765 | 1.470 | 0.6898 | Yes | ||
| 16 | ZHX3 | 6800 | 2054 | 1.110 | 0.6879 | No | ||
| 17 | CRSP2 | 11223 | 2357 | 0.878 | 0.6823 | No | ||
| 18 | E2F6 | 6925 6926 11920 | 2720 | 0.611 | 0.6703 | No | ||
| 19 | ZBTB5 | 15891 | 2772 | 0.573 | 0.6746 | No | ||
| 20 | NRIP1 | 11216 | 3138 | 0.389 | 0.6597 | No | ||
| 21 | DIO2 | 21014 2159 | 3324 | 0.312 | 0.6535 | No | ||
| 22 | IGFBP5 | 4899 | 3418 | 0.283 | 0.6520 | No | ||
| 23 | CDK10 | 3818 6157 10635 3894 | 3477 | 0.266 | 0.6521 | No | ||
| 24 | ETV1 | 4688 8925 8924 | 3759 | 0.198 | 0.6394 | No | ||
| 25 | PLAU | 22084 | 3818 | 0.187 | 0.6386 | No | ||
| 26 | PHF15 | 20467 8050 | 3878 | 0.174 | 0.6375 | No | ||
| 27 | ZIC3 | 10430 | 4357 | 0.105 | 0.6131 | No | ||
| 28 | NPAS4 | 23970 3683 | 4389 | 0.102 | 0.6126 | No | ||
| 29 | PTPRF | 5331 2545 | 4800 | 0.072 | 0.5914 | No | ||
| 30 | CBX7 | 11973 | 5107 | 0.059 | 0.5757 | No | ||
| 31 | LAMC2 | 4983 9266 13806 3975 | 5404 | 0.049 | 0.5603 | No | ||
| 32 | CAPN3 | 8686 2868 | 5768 | 0.039 | 0.5412 | No | ||
| 33 | CALB1 | 4469 | 6500 | 0.025 | 0.5021 | No | ||
| 34 | TAOK2 | 10610 3794 | 6700 | 0.021 | 0.4917 | No | ||
| 35 | HOXD13 | 9114 | 6964 | 0.017 | 0.4777 | No | ||
| 36 | LUZP1 | 6533 11257 2503 | 7571 | 0.009 | 0.4451 | No | ||
| 37 | HSPA14 | 14695 | 8216 | -0.000 | 0.4104 | No | ||
| 38 | SON | 5473 1657 1684 | 8509 | -0.004 | 0.3948 | No | ||
| 39 | KCNH8 | 23197 | 8521 | -0.004 | 0.3942 | No | ||
| 40 | ERBB4 | 13933 4678 | 8852 | -0.009 | 0.3765 | No | ||
| 41 | ING5 | 12314 7273 4039 3964 | 9047 | -0.011 | 0.3662 | No | ||
| 42 | EN2 | 16898 | 10074 | -0.024 | 0.3112 | No | ||
| 43 | MMP16 | 5109 | 10255 | -0.027 | 0.3018 | No | ||
| 44 | FLRT3 | 7730 12930 2673 | 11069 | -0.040 | 0.2585 | No | ||
| 45 | ARPC5 | 12580 7487 | 11164 | -0.042 | 0.2540 | No | ||
| 46 | SIX4 | 5445 | 11390 | -0.047 | 0.2424 | No | ||
| 47 | ARHGEF12 | 19156 | 11758 | -0.055 | 0.2233 | No | ||
| 48 | YWHAZ | 10370 | 11819 | -0.056 | 0.2208 | No | ||
| 49 | CELSR2 | 15194 12000 | 12287 | -0.069 | 0.1964 | No | ||
| 50 | KCNJ2 | 20612 | 12406 | -0.073 | 0.1910 | No | ||
| 51 | STX16 | 10464 | 13392 | -0.115 | 0.1393 | No | ||
| 52 | MMP19 | 7191 | 14008 | -0.166 | 0.1082 | No | ||
| 53 | DYRK1A | 4649 | 14547 | -0.232 | 0.0820 | No | ||
| 54 | SLC39A5 | 3364 19596 | 14734 | -0.260 | 0.0752 | No | ||
| 55 | LRRC8A | 15054 | 14895 | -0.294 | 0.0702 | No | ||
| 56 | MAX | 21034 | 15303 | -0.411 | 0.0533 | No | ||
| 57 | STMN1 | 9261 | 15365 | -0.429 | 0.0552 | No | ||
| 58 | PPP2R5C | 6522 2147 | 15371 | -0.431 | 0.0603 | No | ||
| 59 | SFRS2 | 9807 20136 | 16049 | -0.798 | 0.0335 | No | ||
| 60 | BRPF1 | 17332 | 16229 | -0.946 | 0.0355 | No | ||
| 61 | ACACA | 309 4209 | 16971 | -1.680 | 0.0161 | No | ||
| 62 | UBAP2 | 15912 | 17183 | -1.933 | 0.0284 | No | ||
| 63 | MKLN1 | 6584 11339 | 18116 | -3.978 | 0.0269 | No |