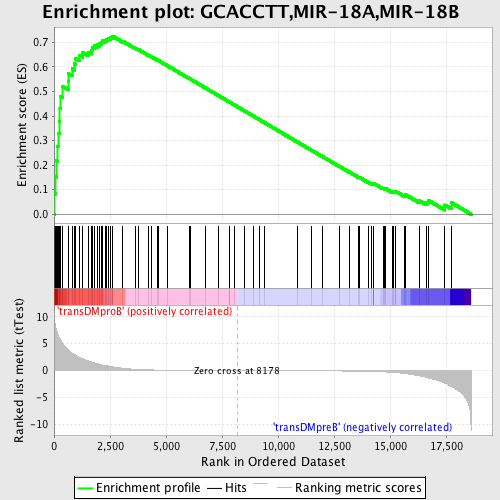
Profile of the Running ES Score & Positions of GeneSet Members on the Rank Ordered List
| Dataset | Set_04_transDMproB_versus_transDMpreB.phenotype_transDMproB_versus_transDMpreB.cls #transDMproB_versus_transDMpreB.phenotype_transDMproB_versus_transDMpreB.cls #transDMproB_versus_transDMpreB_repos |
| Phenotype | phenotype_transDMproB_versus_transDMpreB.cls#transDMproB_versus_transDMpreB_repos |
| Upregulated in class | transDMproB |
| GeneSet | GCACCTT,MIR-18A,MIR-18B |
| Enrichment Score (ES) | 0.7251588 |
| Normalized Enrichment Score (NES) | 1.704737 |
| Nominal p-value | 0.0 |
| FDR q-value | 0.016891139 |
| FWER p-Value | 0.023 |
| PROBE | DESCRIPTION (from dataset) | GENE SYMBOL | GENE_TITLE | RANK IN GENE LIST | RANK METRIC SCORE | RUNNING ES | CORE ENRICHMENT | |
|---|---|---|---|---|---|---|---|---|
| 1 | NEDD9 | 3206 21483 | 16 | 9.789 | 0.0851 | Yes | ||
| 2 | JARID1B | 14123 | 70 | 8.085 | 0.1533 | Yes | ||
| 3 | ARHGEF5 | 12025 | 104 | 7.577 | 0.2180 | Yes | ||
| 4 | CTDSPL | 19279 | 150 | 6.989 | 0.2770 | Yes | ||
| 5 | FRMD4A | 5557 | 207 | 6.302 | 0.3293 | Yes | ||
| 6 | KIT | 16823 | 251 | 5.987 | 0.3796 | Yes | ||
| 7 | ZFP36L1 | 4453 4454 | 261 | 5.908 | 0.4310 | Yes | ||
| 8 | GAB1 | 18828 | 280 | 5.825 | 0.4812 | Yes | ||
| 9 | PRKACB | 15140 | 377 | 5.058 | 0.5205 | Yes | ||
| 10 | RUNX1 | 4481 | 640 | 3.781 | 0.5395 | Yes | ||
| 11 | ETV6 | 17264 | 654 | 3.722 | 0.5715 | Yes | ||
| 12 | RABGAP1 | 10439 | 805 | 3.232 | 0.5918 | Yes | ||
| 13 | ATXN1 | 21477 | 918 | 2.967 | 0.6118 | Yes | ||
| 14 | RAB5C | 20226 | 949 | 2.868 | 0.6354 | Yes | ||
| 15 | IRF2 | 18621 | 1137 | 2.444 | 0.6468 | Yes | ||
| 16 | SAR1A | 20008 | 1268 | 2.180 | 0.6589 | Yes | ||
| 17 | WSB1 | 20330 | 1532 | 1.774 | 0.6603 | Yes | ||
| 18 | STK4 | 14743 | 1681 | 1.594 | 0.6664 | Yes | ||
| 19 | TRIOBP | 2280 670 8476 | 1701 | 1.565 | 0.6791 | Yes | ||
| 20 | NR1H2 | 17846 | 1792 | 1.433 | 0.6868 | Yes | ||
| 21 | NCOA1 | 5154 | 1938 | 1.248 | 0.6899 | Yes | ||
| 22 | PHF2 | 21470 | 2038 | 1.123 | 0.6945 | Yes | ||
| 23 | ANKRD50 | 533 | 2105 | 1.068 | 0.7003 | Yes | ||
| 24 | PACSIN1 | 6257 23322 10744 | 2144 | 1.023 | 0.7072 | Yes | ||
| 25 | FCHSD2 | 18172 | 2274 | 0.964 | 0.7087 | Yes | ||
| 26 | PURB | 5335 | 2341 | 0.890 | 0.7130 | Yes | ||
| 27 | SMAD2 | 23511 | 2417 | 0.844 | 0.7164 | Yes | ||
| 28 | TEX2 | 5725 20181 20182 | 2512 | 0.772 | 0.7181 | Yes | ||
| 29 | ARL15 | 21559 | 2593 | 0.704 | 0.7200 | Yes | ||
| 30 | PHF19 | 13150 | 2610 | 0.691 | 0.7252 | Yes | ||
| 31 | ALCAM | 4367 | 3070 | 0.424 | 0.7041 | No | ||
| 32 | SNURF | 2251 | 3644 | 0.224 | 0.6752 | No | ||
| 33 | NR3C1 | 9043 | 3766 | 0.197 | 0.6704 | No | ||
| 34 | PIAS3 | 15491 672 1906 | 4213 | 0.120 | 0.6474 | No | ||
| 35 | LIN28 | 15723 | 4329 | 0.108 | 0.6421 | No | ||
| 36 | MESP1 | 17786 | 4597 | 0.085 | 0.6285 | No | ||
| 37 | CTGF | 20068 | 4680 | 0.080 | 0.6248 | No | ||
| 38 | EHMT1 | 13401 14670 2756 8090 | 5076 | 0.060 | 0.6040 | No | ||
| 39 | TRIM2 | 13485 8157 | 6064 | 0.033 | 0.5510 | No | ||
| 40 | NFAT5 | 3921 7037 12036 | 6081 | 0.033 | 0.5505 | No | ||
| 41 | CDC42 | 4503 8722 4504 2465 | 6775 | 0.020 | 0.5133 | No | ||
| 42 | SH3BP4 | 8270 | 7331 | 0.012 | 0.4834 | No | ||
| 43 | PTGFRN | 15224 | 7822 | 0.005 | 0.4571 | No | ||
| 44 | SIM2 | 22693 | 7848 | 0.004 | 0.4557 | No | ||
| 45 | HIF1A | 4850 | 8051 | 0.002 | 0.4449 | No | ||
| 46 | SON | 5473 1657 1684 | 8509 | -0.004 | 0.4203 | No | ||
| 47 | SOCS5 | 1619 23141 | 8896 | -0.009 | 0.3995 | No | ||
| 48 | BHLHB5 | 15629 | 9170 | -0.012 | 0.3849 | No | ||
| 49 | DPP10 | 13850 | 9376 | -0.015 | 0.3740 | No | ||
| 50 | GLRB | 15312 1846 | 10876 | -0.037 | 0.2934 | No | ||
| 51 | RAB11FIP2 | 23635 | 11481 | -0.048 | 0.2613 | No | ||
| 52 | ESR1 | 20097 4685 | 11994 | -0.061 | 0.2342 | No | ||
| 53 | AKR1D1 | 17483 | 12751 | -0.085 | 0.1942 | No | ||
| 54 | NAV1 | 3978 5681 | 13169 | -0.103 | 0.1726 | No | ||
| 55 | AEBP2 | 4359 | 13601 | -0.129 | 0.1505 | No | ||
| 56 | PARP6 | 19419 2979 3156 | 13637 | -0.132 | 0.1498 | No | ||
| 57 | PRICKLE2 | 10837 | 14017 | -0.168 | 0.1308 | No | ||
| 58 | CRIM1 | 403 | 14168 | -0.180 | 0.1243 | No | ||
| 59 | CLASP2 | 13338 | 14247 | -0.191 | 0.1218 | No | ||
| 60 | GCLC | 19374 | 14253 | -0.192 | 0.1232 | No | ||
| 61 | PERQ1 | 7168 | 14263 | -0.193 | 0.1244 | No | ||
| 62 | RHOT1 | 12227 | 14273 | -0.194 | 0.1256 | No | ||
| 63 | MAN1A2 | 5076 5075 | 14695 | -0.254 | 0.1051 | No | ||
| 64 | IGF1 | 3352 9156 3409 | 14748 | -0.264 | 0.1047 | No | ||
| 65 | HSF2 | 9128 | 14806 | -0.273 | 0.1040 | No | ||
| 66 | ZBTB4 | 13267 | 15094 | -0.347 | 0.0915 | No | ||
| 67 | CLK2 | 1883 15544 | 15163 | -0.366 | 0.0911 | No | ||
| 68 | MEF2D | 9379 | 15241 | -0.390 | 0.0904 | No | ||
| 69 | ASXL2 | 7957 | 15248 | -0.392 | 0.0935 | No | ||
| 70 | MDGA1 | 13231 | 15654 | -0.554 | 0.0765 | No | ||
| 71 | FNBP1 | 4732 | 15667 | -0.558 | 0.0808 | No | ||
| 72 | XYLT2 | 20288 | 16296 | -0.996 | 0.0556 | No | ||
| 73 | BTG3 | 8664 | 16624 | -1.269 | 0.0491 | No | ||
| 74 | TARDBP | 10520 6066 | 16700 | -1.363 | 0.0571 | No | ||
| 75 | ADD3 | 23812 3694 | 17439 | -2.337 | 0.0378 | No | ||
| 76 | TRIB2 | 21102 | 17728 | -2.918 | 0.0479 | No |

