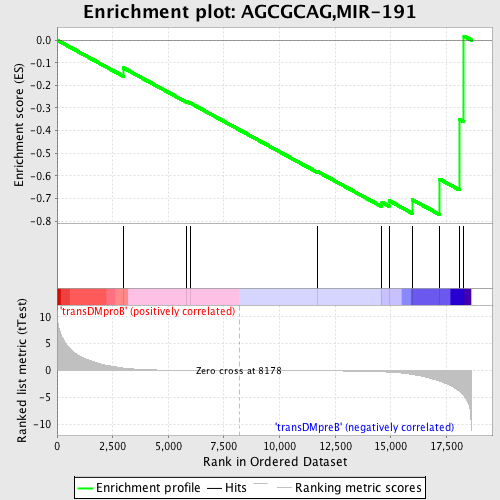
Profile of the Running ES Score & Positions of GeneSet Members on the Rank Ordered List
| Dataset | Set_04_transDMproB_versus_transDMpreB.phenotype_transDMproB_versus_transDMpreB.cls #transDMproB_versus_transDMpreB.phenotype_transDMproB_versus_transDMpreB.cls #transDMproB_versus_transDMpreB_repos |
| Phenotype | phenotype_transDMproB_versus_transDMpreB.cls#transDMproB_versus_transDMpreB_repos |
| Upregulated in class | transDMpreB |
| GeneSet | AGCGCAG,MIR-191 |
| Enrichment Score (ES) | -0.77091575 |
| Normalized Enrichment Score (NES) | -1.2655073 |
| Nominal p-value | 0.17843138 |
| FDR q-value | 0.5521508 |
| FWER p-Value | 1.0 |
| PROBE | DESCRIPTION (from dataset) | GENE SYMBOL | GENE_TITLE | RANK IN GENE LIST | RANK METRIC SCORE | RUNNING ES | CORE ENRICHMENT | |
|---|---|---|---|---|---|---|---|---|
| 1 | SPEN | 12112 | 2978 | 0.464 | -0.1224 | No | ||
| 2 | HMGB1 | 9094 4855 | 5814 | 0.038 | -0.2716 | No | ||
| 3 | CHRD | 22817 | 5981 | 0.035 | -0.2777 | No | ||
| 4 | DIO3 | 19359 | 11704 | -0.053 | -0.5809 | No | ||
| 5 | OGT | 4241 24274 | 14600 | -0.241 | -0.7170 | Yes | ||
| 6 | MAGI1 | 19828 4816 1179 | 14922 | -0.300 | -0.7099 | Yes | ||
| 7 | EGR3 | 4656 | 15973 | -0.744 | -0.7059 | Yes | ||
| 8 | UBAP2 | 15912 | 17183 | -1.933 | -0.6140 | Yes | ||
| 9 | SNRP70 | 1186 | 18077 | -3.843 | -0.3501 | Yes | ||
| 10 | ETF1 | 23467 | 18287 | -4.669 | 0.0177 | Yes |

