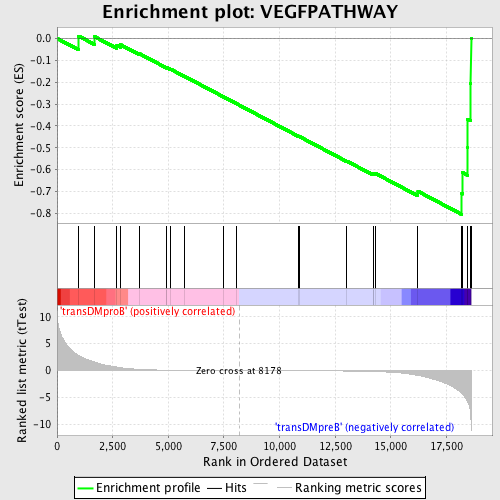
Profile of the Running ES Score & Positions of GeneSet Members on the Rank Ordered List
| Dataset | Set_04_transDMproB_versus_transDMpreB.phenotype_transDMproB_versus_transDMpreB.cls #transDMproB_versus_transDMpreB.phenotype_transDMproB_versus_transDMpreB.cls #transDMproB_versus_transDMpreB_repos |
| Phenotype | phenotype_transDMproB_versus_transDMpreB.cls#transDMproB_versus_transDMpreB_repos |
| Upregulated in class | transDMpreB |
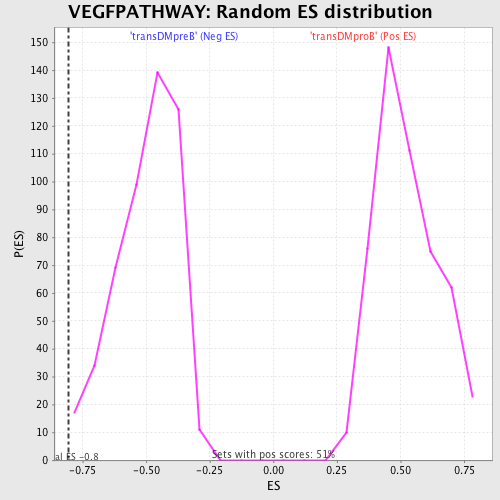
| GeneSet | VEGFPATHWAY |
| Enrichment Score (ES) | -0.80551463 |
| Normalized Enrichment Score (NES) | -1.618242 |
| Nominal p-value | 0.004040404 |
| FDR q-value | 0.06976562 |
| FWER p-Value | 0.346 |
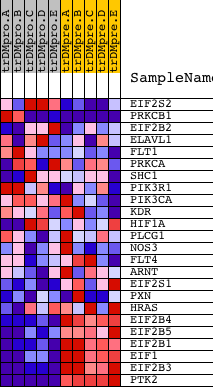
| PROBE | DESCRIPTION (from dataset) | GENE SYMBOL | GENE_TITLE | RANK IN GENE LIST | RANK METRIC SCORE | RUNNING ES | CORE ENRICHMENT | |
|---|---|---|---|---|---|---|---|---|
| 1 | EIF2S2 | 7406 14383 | 970 | 2.828 | 0.0108 | No | ||
| 2 | PRKCB1 | 1693 9574 | 1672 | 1.605 | 0.0089 | No | ||
| 3 | EIF2B2 | 21204 | 2683 | 0.637 | -0.0312 | No | ||
| 4 | ELAVL1 | 4888 | 2855 | 0.523 | -0.0287 | No | ||
| 5 | FLT1 | 3483 16287 | 3716 | 0.207 | -0.0704 | No | ||
| 6 | PRKCA | 20174 | 4927 | 0.066 | -0.1340 | No | ||
| 7 | SHC1 | 9813 9812 5430 | 4928 | 0.066 | -0.1325 | No | ||
| 8 | PIK3R1 | 3170 | 5108 | 0.059 | -0.1408 | No | ||
| 9 | PIK3CA | 9562 | 5729 | 0.040 | -0.1733 | No | ||
| 10 | KDR | 16509 | 7477 | 0.010 | -0.2670 | No | ||
| 11 | HIF1A | 4850 | 8051 | 0.002 | -0.2978 | No | ||
| 12 | PLCG1 | 14753 | 10828 | -0.036 | -0.4463 | No | ||
| 13 | NOS3 | 16906 885 | 10879 | -0.037 | -0.4482 | No | ||
| 14 | FLT4 | 20904 1461 | 13019 | -0.096 | -0.5611 | No | ||
| 15 | ARNT | 4413 1857 | 14203 | -0.185 | -0.6206 | No | ||
| 16 | EIF2S1 | 4658 | 14218 | -0.187 | -0.6172 | No | ||
| 17 | PXN | 5339 3573 | 14294 | -0.196 | -0.6168 | No | ||
| 18 | HRAS | 4868 | 16218 | -0.935 | -0.6994 | No | ||
| 19 | EIF2B4 | 16574 | 18192 | -4.269 | -0.7104 | Yes | ||
| 20 | EIF2B5 | 1719 22822 | 18220 | -4.393 | -0.6139 | Yes | ||
| 21 | EIF2B1 | 16368 3458 | 18450 | -5.739 | -0.4983 | Yes | ||
| 22 | EIF1 | 23563 | 18457 | -5.837 | -0.3685 | Yes | ||
| 23 | EIF2B3 | 16118 | 18573 | -7.596 | -0.2054 | Yes | ||
| 24 | PTK2 | 22271 | 18603 | -9.319 | 0.0007 | Yes |