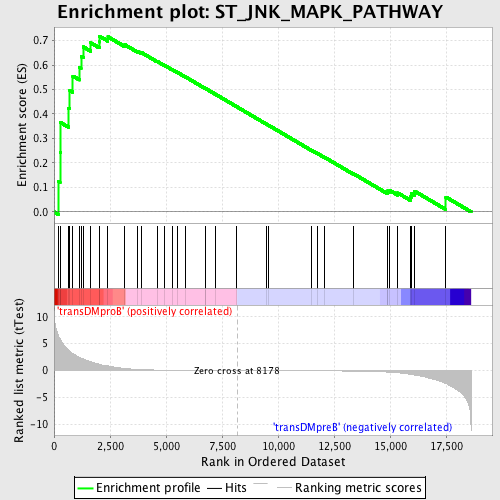
Profile of the Running ES Score & Positions of GeneSet Members on the Rank Ordered List
| Dataset | Set_04_transDMproB_versus_transDMpreB.phenotype_transDMproB_versus_transDMpreB.cls #transDMproB_versus_transDMpreB.phenotype_transDMproB_versus_transDMpreB.cls #transDMproB_versus_transDMpreB_repos |
| Phenotype | phenotype_transDMproB_versus_transDMpreB.cls#transDMproB_versus_transDMpreB_repos |
| Upregulated in class | transDMproB |
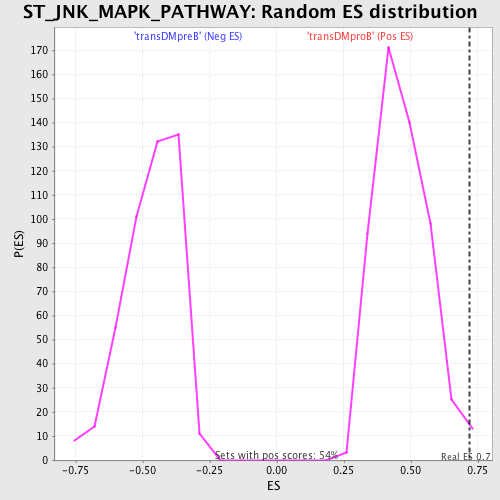
| GeneSet | ST_JNK_MAPK_PATHWAY |
| Enrichment Score (ES) | 0.7181294 |
| Normalized Enrichment Score (NES) | 1.5344887 |
| Nominal p-value | 0.012867647 |
| FDR q-value | 0.2487106 |
| FWER p-Value | 0.886 |
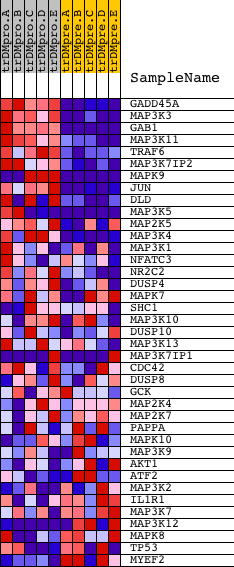
| PROBE | DESCRIPTION (from dataset) | GENE SYMBOL | GENE_TITLE | RANK IN GENE LIST | RANK METRIC SCORE | RUNNING ES | CORE ENRICHMENT | |
|---|---|---|---|---|---|---|---|---|
| 1 | GADD45A | 17129 | 196 | 6.435 | 0.1244 | Yes | ||
| 2 | MAP3K3 | 20626 | 266 | 5.885 | 0.2441 | Yes | ||
| 3 | GAB1 | 18828 | 280 | 5.825 | 0.3655 | Yes | ||
| 4 | MAP3K11 | 11163 | 651 | 3.729 | 0.4238 | Yes | ||
| 5 | TRAF6 | 5797 14940 | 701 | 3.574 | 0.4961 | Yes | ||
| 6 | MAP3K7IP2 | 19827 | 837 | 3.156 | 0.5550 | Yes | ||
| 7 | MAPK9 | 1233 20903 1383 | 1138 | 2.444 | 0.5901 | Yes | ||
| 8 | JUN | 15832 | 1203 | 2.302 | 0.6349 | Yes | ||
| 9 | DLD | 2097 21090 | 1304 | 2.128 | 0.6741 | Yes | ||
| 10 | MAP3K5 | 20079 11166 | 1636 | 1.636 | 0.6906 | Yes | ||
| 11 | MAP2K5 | 19088 | 2016 | 1.152 | 0.6943 | Yes | ||
| 12 | MAP3K4 | 23126 | 2022 | 1.147 | 0.7181 | Yes | ||
| 13 | MAP3K1 | 21348 | 2404 | 0.849 | 0.7154 | No | ||
| 14 | NFATC3 | 5169 | 3159 | 0.379 | 0.6828 | No | ||
| 15 | NR2C2 | 10216 | 3721 | 0.206 | 0.6569 | No | ||
| 16 | DUSP4 | 18632 3820 | 3906 | 0.168 | 0.6505 | No | ||
| 17 | MAPK7 | 1381 20414 | 4612 | 0.084 | 0.6144 | No | ||
| 18 | SHC1 | 9813 9812 5430 | 4928 | 0.066 | 0.5988 | No | ||
| 19 | MAP3K10 | 3831 17916 | 5271 | 0.054 | 0.5815 | No | ||
| 20 | DUSP10 | 4003 14016 | 5521 | 0.046 | 0.5691 | No | ||
| 21 | MAP3K13 | 22814 | 5881 | 0.037 | 0.5505 | No | ||
| 22 | MAP3K7IP1 | 2193 2171 22419 | 6756 | 0.020 | 0.5039 | No | ||
| 23 | CDC42 | 4503 8722 4504 2465 | 6775 | 0.020 | 0.5034 | No | ||
| 24 | DUSP8 | 9493 | 7183 | 0.014 | 0.4817 | No | ||
| 25 | GCK | 20535 | 8153 | 0.000 | 0.4296 | No | ||
| 26 | MAP2K4 | 20405 | 9480 | -0.016 | 0.3586 | No | ||
| 27 | MAP2K7 | 6453 | 9569 | -0.017 | 0.3542 | No | ||
| 28 | PAPPA | 16190 | 11504 | -0.049 | 0.2511 | No | ||
| 29 | MAPK10 | 11169 | 11773 | -0.055 | 0.2378 | No | ||
| 30 | MAP3K9 | 6872 | 12060 | -0.062 | 0.2237 | No | ||
| 31 | AKT1 | 8568 | 13376 | -0.114 | 0.1554 | No | ||
| 32 | ATF2 | 4418 2759 | 14872 | -0.288 | 0.0809 | No | ||
| 33 | MAP3K2 | 11165 | 14901 | -0.295 | 0.0856 | No | ||
| 34 | IL1R1 | 14264 3987 | 14990 | -0.314 | 0.0874 | No | ||
| 35 | MAP3K7 | 16255 | 15341 | -0.423 | 0.0775 | No | ||
| 36 | MAP3K12 | 6454 11164 | 15918 | -0.704 | 0.0612 | No | ||
| 37 | MAPK8 | 6459 | 15940 | -0.722 | 0.0752 | No | ||
| 38 | TP53 | 20822 | 16099 | -0.845 | 0.0845 | No | ||
| 39 | MYEF2 | 5140 | 17488 | -2.431 | 0.0607 | No |