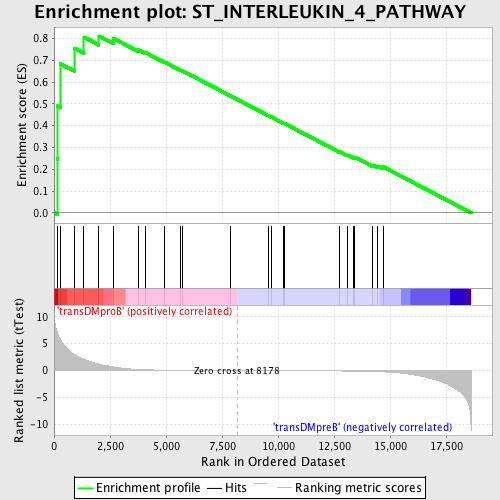
Profile of the Running ES Score & Positions of GeneSet Members on the Rank Ordered List
| Dataset | Set_04_transDMproB_versus_transDMpreB.phenotype_transDMproB_versus_transDMpreB.cls #transDMproB_versus_transDMpreB.phenotype_transDMproB_versus_transDMpreB.cls #transDMproB_versus_transDMpreB_repos |
| Phenotype | phenotype_transDMproB_versus_transDMpreB.cls#transDMproB_versus_transDMpreB_repos |
| Upregulated in class | transDMproB |
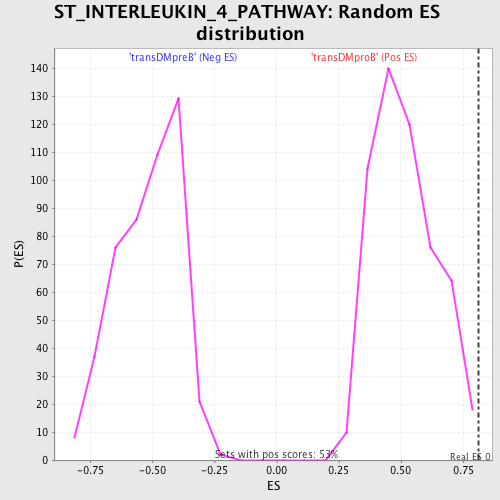
| GeneSet | ST_INTERLEUKIN_4_PATHWAY |
| Enrichment Score (ES) | 0.8105437 |
| Normalized Enrichment Score (NES) | 1.5736358 |
| Nominal p-value | 0.009398496 |
| FDR q-value | 0.33508518 |
| FWER p-Value | 0.656 |
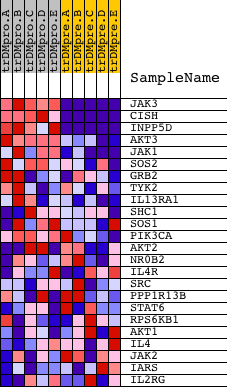
| PROBE | DESCRIPTION (from dataset) | GENE SYMBOL | GENE_TITLE | RANK IN GENE LIST | RANK METRIC SCORE | RUNNING ES | CORE ENRICHMENT | |
|---|---|---|---|---|---|---|---|---|
| 1 | JAK3 | 9198 4936 | 133 | 7.251 | 0.2479 | Yes | ||
| 2 | CISH | 8743 | 158 | 6.932 | 0.4904 | Yes | ||
| 3 | INPP5D | 14198 | 297 | 5.689 | 0.6831 | Yes | ||
| 4 | AKT3 | 13739 982 | 908 | 2.985 | 0.7553 | Yes | ||
| 5 | JAK1 | 15827 | 1333 | 2.074 | 0.8055 | Yes | ||
| 6 | SOS2 | 21049 | 2002 | 1.166 | 0.8105 | Yes | ||
| 7 | GRB2 | 20149 | 2633 | 0.675 | 0.8004 | No | ||
| 8 | TYK2 | 12058 19215 | 3755 | 0.199 | 0.7471 | No | ||
| 9 | IL13RA1 | 24361 | 4068 | 0.141 | 0.7353 | No | ||
| 10 | SHC1 | 9813 9812 5430 | 4928 | 0.066 | 0.6914 | No | ||
| 11 | SOS1 | 5476 | 5642 | 0.043 | 0.6546 | No | ||
| 12 | PIK3CA | 9562 | 5729 | 0.040 | 0.6514 | No | ||
| 13 | AKT2 | 4365 4366 | 7867 | 0.004 | 0.5366 | No | ||
| 14 | NR0B2 | 16050 | 9572 | -0.017 | 0.4455 | No | ||
| 15 | IL4R | 18085 | 9682 | -0.019 | 0.4403 | No | ||
| 16 | SRC | 5507 | 10226 | -0.026 | 0.4121 | No | ||
| 17 | PPP1R13B | 10211 20980 | 10298 | -0.027 | 0.4092 | No | ||
| 18 | STAT6 | 19854 9909 | 12746 | -0.085 | 0.2806 | No | ||
| 19 | RPS6KB1 | 7815 1207 13040 | 13099 | -0.100 | 0.2651 | No | ||
| 20 | AKT1 | 8568 | 13376 | -0.114 | 0.2543 | No | ||
| 21 | IL4 | 9174 | 13421 | -0.117 | 0.2560 | No | ||
| 22 | JAK2 | 23893 9197 3706 | 14224 | -0.188 | 0.2195 | No | ||
| 23 | IARS | 4190 8361 8362 | 14448 | -0.217 | 0.2152 | No | ||
| 24 | IL2RG | 24096 | 14693 | -0.254 | 0.2110 | No |