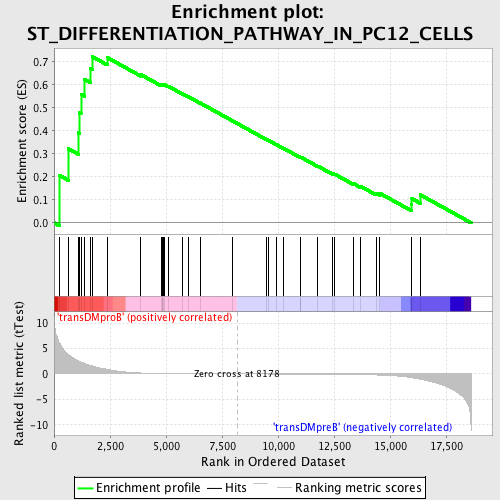
Profile of the Running ES Score & Positions of GeneSet Members on the Rank Ordered List
| Dataset | Set_04_transDMproB_versus_transDMpreB.phenotype_transDMproB_versus_transDMpreB.cls #transDMproB_versus_transDMpreB.phenotype_transDMproB_versus_transDMpreB.cls #transDMproB_versus_transDMpreB_repos |
| Phenotype | phenotype_transDMproB_versus_transDMpreB.cls#transDMproB_versus_transDMpreB_repos |
| Upregulated in class | transDMproB |
| GeneSet | ST_DIFFERENTIATION_PATHWAY_IN_PC12_CELLS |
| Enrichment Score (ES) | 0.7216576 |
| Normalized Enrichment Score (NES) | 1.5086162 |
| Nominal p-value | 0.007633588 |
| FDR q-value | 0.24099343 |
| FWER p-Value | 0.957 |
| PROBE | DESCRIPTION (from dataset) | GENE SYMBOL | GENE_TITLE | RANK IN GENE LIST | RANK METRIC SCORE | RUNNING ES | CORE ENRICHMENT | |
|---|---|---|---|---|---|---|---|---|
| 1 | EGR1 | 23598 | 249 | 5.993 | 0.2058 | Yes | ||
| 2 | MAPK1 | 1642 11167 | 646 | 3.755 | 0.3218 | Yes | ||
| 3 | CRKL | 4560 | 1082 | 2.544 | 0.3915 | Yes | ||
| 4 | MAPK9 | 1233 20903 1383 | 1138 | 2.444 | 0.4779 | Yes | ||
| 5 | JUN | 15832 | 1203 | 2.302 | 0.5587 | Yes | ||
| 6 | DAG1 | 18996 8837 | 1361 | 2.019 | 0.6241 | Yes | ||
| 7 | PIK3CD | 9563 | 1614 | 1.664 | 0.6714 | Yes | ||
| 8 | CREBBP | 22682 8783 | 1722 | 1.533 | 0.7217 | Yes | ||
| 9 | CAMP | 18990 | 2367 | 0.872 | 0.7189 | No | ||
| 10 | CREB1 | 3990 8782 4558 4093 | 3867 | 0.176 | 0.6447 | No | ||
| 11 | TH | 17548 | 4784 | 0.073 | 0.5980 | No | ||
| 12 | MAPK3 | 6458 11170 | 4819 | 0.071 | 0.5988 | No | ||
| 13 | EGR4 | 24483 | 4837 | 0.071 | 0.6005 | No | ||
| 14 | ATF1 | 8634 4417 | 4860 | 0.070 | 0.6019 | No | ||
| 15 | SHC1 | 9813 9812 5430 | 4928 | 0.066 | 0.6007 | No | ||
| 16 | PIK3R1 | 3170 | 5108 | 0.059 | 0.5932 | No | ||
| 17 | PIK3CA | 9562 | 5729 | 0.040 | 0.5613 | No | ||
| 18 | CREB5 | 10551 | 5982 | 0.035 | 0.5490 | No | ||
| 19 | PTPN11 | 5326 16391 9660 | 6513 | 0.024 | 0.5214 | No | ||
| 20 | PIK3C2G | 17253 | 7958 | 0.003 | 0.4438 | No | ||
| 21 | MAP2K4 | 20405 | 9480 | -0.016 | 0.3625 | No | ||
| 22 | MAP2K7 | 6453 | 9569 | -0.017 | 0.3584 | No | ||
| 23 | RPS6KA3 | 8490 | 9929 | -0.022 | 0.3399 | No | ||
| 24 | SRC | 5507 | 10226 | -0.026 | 0.3249 | No | ||
| 25 | EGR2 | 8886 | 10983 | -0.039 | 0.2857 | No | ||
| 26 | MAPK8IP3 | 11402 23080 | 11012 | -0.039 | 0.2856 | No | ||
| 27 | MAPK10 | 11169 | 11773 | -0.055 | 0.2467 | No | ||
| 28 | GNAQ | 4786 23909 3685 | 12422 | -0.073 | 0.2145 | No | ||
| 29 | NTRK1 | 15299 | 12535 | -0.078 | 0.2113 | No | ||
| 30 | AKT1 | 8568 | 13376 | -0.114 | 0.1703 | No | ||
| 31 | CREB3 | 16231 | 13664 | -0.135 | 0.1598 | No | ||
| 32 | TERF2IP | 12184 18463 7167 | 14369 | -0.206 | 0.1294 | No | ||
| 33 | MAPK8IP2 | 77 | 14533 | -0.230 | 0.1290 | No | ||
| 34 | MAPK8 | 6459 | 15940 | -0.722 | 0.0798 | No | ||
| 35 | EGR3 | 4656 | 15973 | -0.744 | 0.1053 | No | ||
| 36 | ASAH1 | 3835 3853 8630 | 16338 | -1.010 | 0.1226 | No |

