Profile of the Running ES Score & Positions of GeneSet Members on the Rank Ordered List
| Dataset | Set_04_transDMproB_versus_transDMpreB.phenotype_transDMproB_versus_transDMpreB.cls #transDMproB_versus_transDMpreB.phenotype_transDMproB_versus_transDMpreB.cls #transDMproB_versus_transDMpreB_repos |
| Phenotype | phenotype_transDMproB_versus_transDMpreB.cls#transDMproB_versus_transDMpreB_repos |
| Upregulated in class | transDMpreB |
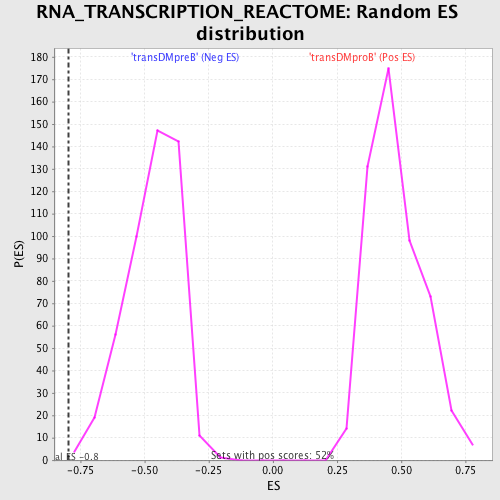
| GeneSet | RNA_TRANSCRIPTION_REACTOME |
| Enrichment Score (ES) | -0.7960206 |
| Normalized Enrichment Score (NES) | -1.6988403 |
| Nominal p-value | 0.0020833334 |
| FDR q-value | 0.0446813 |
| FWER p-Value | 0.065 |
| PROBE | DESCRIPTION (from dataset) | GENE SYMBOL | GENE_TITLE | RANK IN GENE LIST | RANK METRIC SCORE | RUNNING ES | CORE ENRICHMENT | |
|---|---|---|---|---|---|---|---|---|
| 1 | TAF12 | 2537 16058 2338 | 770 | 3.303 | 0.0091 | No | ||
| 2 | GTF2B | 10489 | 3469 | 0.268 | -0.1320 | No | ||
| 3 | TAF13 | 8288 | 3504 | 0.259 | -0.1299 | No | ||
| 4 | POLR2I | 12839 | 4567 | 0.087 | -0.1857 | No | ||
| 5 | TAF7 | 6287 1968 | 7028 | 0.016 | -0.3179 | No | ||
| 6 | ILK | 9177 1618 | 7628 | 0.008 | -0.3500 | No | ||
| 7 | TAF9 | 3213 8433 | 8410 | -0.003 | -0.3920 | No | ||
| 8 | POLR2B | 16817 | 9561 | -0.017 | -0.4536 | No | ||
| 9 | POLR3K | 12447 7372 | 10060 | -0.024 | -0.4800 | No | ||
| 10 | POLR2C | 9750 | 11135 | -0.042 | -0.5372 | No | ||
| 11 | CDK7 | 21365 | 11619 | -0.052 | -0.5624 | No | ||
| 12 | GTF2A2 | 10654 | 11993 | -0.061 | -0.5815 | No | ||
| 13 | GTF2H1 | 4069 18236 | 12248 | -0.068 | -0.5941 | No | ||
| 14 | POLR3D | 21760 12456 | 13499 | -0.122 | -0.6596 | No | ||
| 15 | MNAT1 | 9396 2161 | 14706 | -0.256 | -0.7205 | No | ||
| 16 | TAF5 | 23833 5934 3759 | 15310 | -0.414 | -0.7467 | No | ||
| 17 | POLR2A | 5394 | 16021 | -0.780 | -0.7729 | No | ||
| 18 | POLR1A | 9749 5393 | 16138 | -0.877 | -0.7658 | No | ||
| 19 | GTF2E1 | 22597 | 16701 | -1.364 | -0.7752 | Yes | ||
| 20 | TAF6 | 16322 891 | 16824 | -1.518 | -0.7585 | Yes | ||
| 21 | ERCC3 | 23605 | 16832 | -1.531 | -0.7355 | Yes | ||
| 22 | GTF2E2 | 18635 | 16888 | -1.589 | -0.7141 | Yes | ||
| 23 | TBP | 671 1554 | 17049 | -1.751 | -0.6959 | Yes | ||
| 24 | POLR2K | 9413 | 17076 | -1.786 | -0.6700 | Yes | ||
| 25 | POLR2E | 3325 19699 | 17108 | -1.814 | -0.6440 | Yes | ||
| 26 | POLR2G | 23753 | 17143 | -1.872 | -0.6171 | Yes | ||
| 27 | POLR3H | 13460 8135 | 17517 | -2.467 | -0.5995 | Yes | ||
| 28 | POLR2J | 16672 | 17714 | -2.890 | -0.5658 | Yes | ||
| 29 | GTF2H2 | 6236 | 18200 | -4.311 | -0.5260 | Yes | ||
| 30 | GTF2H4 | 22999 | 18232 | -4.438 | -0.4598 | Yes | ||
| 31 | POLR2H | 10888 | 18316 | -4.847 | -0.3901 | Yes | ||
| 32 | GTF2F2 | 21750 | 18429 | -5.557 | -0.3112 | Yes | ||
| 33 | POLR3E | 18100 | 18431 | -5.564 | -0.2261 | Yes | ||
| 34 | POLR3B | 12875 | 18537 | -6.688 | -0.1295 | Yes | ||
| 35 | POLR1B | 14857 | 18598 | -8.740 | 0.0010 | Yes |