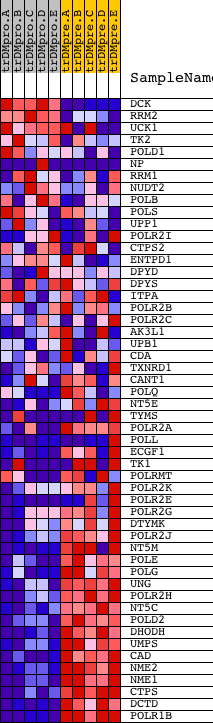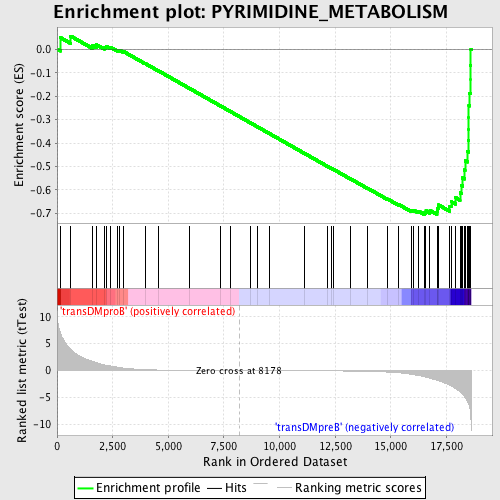
Profile of the Running ES Score & Positions of GeneSet Members on the Rank Ordered List
| Dataset | Set_04_transDMproB_versus_transDMpreB.phenotype_transDMproB_versus_transDMpreB.cls #transDMproB_versus_transDMpreB.phenotype_transDMproB_versus_transDMpreB.cls #transDMproB_versus_transDMpreB_repos |
| Phenotype | phenotype_transDMproB_versus_transDMpreB.cls#transDMproB_versus_transDMpreB_repos |
| Upregulated in class | transDMpreB |
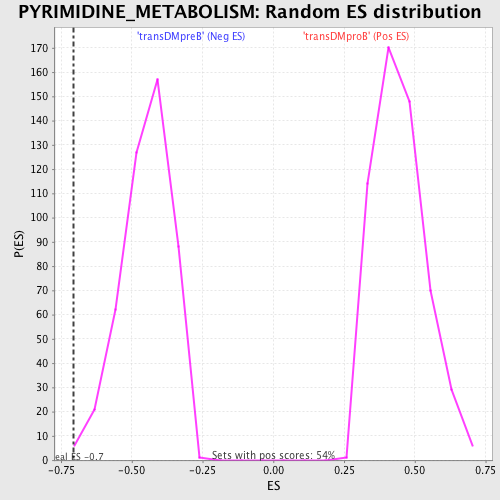
| GeneSet | PYRIMIDINE_METABOLISM |
| Enrichment Score (ES) | -0.70490575 |
| Normalized Enrichment Score (NES) | -1.5703307 |
| Nominal p-value | 0.008658009 |
| FDR q-value | 0.07974344 |
| FWER p-Value | 0.646 |
| PROBE | DESCRIPTION (from dataset) | GENE SYMBOL | GENE_TITLE | RANK IN GENE LIST | RANK METRIC SCORE | RUNNING ES | CORE ENRICHMENT | |
|---|---|---|---|---|---|---|---|---|
| 1 | DCK | 16808 | 138 | 7.202 | 0.0503 | No | ||
| 2 | RRM2 | 5401 5400 | 611 | 3.902 | 0.0562 | No | ||
| 3 | UCK1 | 10254 5831 10253 | 1574 | 1.716 | 0.0181 | No | ||
| 4 | TK2 | 18779 | 1772 | 1.459 | 0.0192 | No | ||
| 5 | POLD1 | 17847 | 2113 | 1.052 | 0.0093 | No | ||
| 6 | NP | 22027 9597 5273 5274 | 2199 | 1.000 | 0.0128 | No | ||
| 7 | RRM1 | 18163 | 2409 | 0.847 | 0.0083 | No | ||
| 8 | NUDT2 | 16239 | 2714 | 0.615 | -0.0031 | No | ||
| 9 | POLB | 9599 | 2809 | 0.551 | -0.0038 | No | ||
| 10 | POLS | 9963 | 2990 | 0.458 | -0.0098 | No | ||
| 11 | UPP1 | 20947 1385 | 3960 | 0.160 | -0.0607 | No | ||
| 12 | POLR2I | 12839 | 4567 | 0.087 | -0.0926 | No | ||
| 13 | CTPS2 | 12060 2571 | 5958 | 0.035 | -0.1672 | No | ||
| 14 | ENTPD1 | 4495 | 7360 | 0.012 | -0.2426 | No | ||
| 15 | DPYD | 15437 | 7772 | 0.006 | -0.2647 | No | ||
| 16 | DPYS | 22305 | 8671 | -0.006 | -0.3130 | No | ||
| 17 | ITPA | 9193 | 8996 | -0.010 | -0.3304 | No | ||
| 18 | POLR2B | 16817 | 9561 | -0.017 | -0.3606 | No | ||
| 19 | POLR2C | 9750 | 11135 | -0.042 | -0.4450 | No | ||
| 20 | AK3L1 | 8564 | 12166 | -0.066 | -0.5000 | No | ||
| 21 | UPB1 | 19988 3389 | 12329 | -0.070 | -0.5081 | No | ||
| 22 | CDA | 15702 | 12424 | -0.073 | -0.5126 | No | ||
| 23 | TXNRD1 | 19923 | 13170 | -0.103 | -0.5519 | No | ||
| 24 | CANT1 | 13304 | 13957 | -0.160 | -0.5930 | No | ||
| 25 | POLQ | 13407 22768 | 14850 | -0.283 | -0.6387 | No | ||
| 26 | NT5E | 19360 18702 | 15361 | -0.428 | -0.6628 | No | ||
| 27 | TYMS | 5810 5809 3606 3598 | 15922 | -0.710 | -0.6872 | No | ||
| 28 | POLR2A | 5394 | 16021 | -0.780 | -0.6863 | No | ||
| 29 | POLL | 23658 3688 | 16240 | -0.961 | -0.6903 | No | ||
| 30 | ECGF1 | 22160 | 16512 | -1.147 | -0.6957 | Yes | ||
| 31 | TK1 | 1457 10182 5762 | 16580 | -1.227 | -0.6895 | Yes | ||
| 32 | POLRMT | 19705 | 16759 | -1.444 | -0.6875 | Yes | ||
| 33 | POLR2K | 9413 | 17076 | -1.786 | -0.6902 | Yes | ||
| 34 | POLR2E | 3325 19699 | 17108 | -1.814 | -0.6773 | Yes | ||
| 35 | POLR2G | 23753 | 17143 | -1.872 | -0.6641 | Yes | ||
| 36 | DTYMK | 5776 | 17636 | -2.721 | -0.6688 | Yes | ||
| 37 | POLR2J | 16672 | 17714 | -2.890 | -0.6498 | Yes | ||
| 38 | NT5M | 8345 4175 | 17914 | -3.392 | -0.6333 | Yes | ||
| 39 | POLE | 16755 | 18111 | -3.955 | -0.6121 | Yes | ||
| 40 | POLG | 17789 | 18186 | -4.245 | -0.5821 | Yes | ||
| 41 | UNG | 10257 16744 | 18224 | -4.409 | -0.5487 | Yes | ||
| 42 | POLR2H | 10888 | 18316 | -4.847 | -0.5147 | Yes | ||
| 43 | NT5C | 20151 | 18338 | -5.003 | -0.4758 | Yes | ||
| 44 | POLD2 | 20537 | 18438 | -5.603 | -0.4362 | Yes | ||
| 45 | DHODH | 7152 | 18486 | -6.100 | -0.3898 | Yes | ||
| 46 | UMPS | 22606 1760 | 18497 | -6.201 | -0.3406 | Yes | ||
| 47 | CAD | 16886 | 18503 | -6.237 | -0.2908 | Yes | ||
| 48 | NME2 | 9468 | 18508 | -6.307 | -0.2404 | Yes | ||
| 49 | NME1 | 9467 | 18540 | -6.712 | -0.1883 | Yes | ||
| 50 | CTPS | 2514 15772 | 18574 | -7.597 | -0.1291 | Yes | ||
| 51 | DCTD | 18620 | 18577 | -7.631 | -0.0680 | Yes | ||
| 52 | POLR1B | 14857 | 18598 | -8.740 | 0.0010 | Yes |