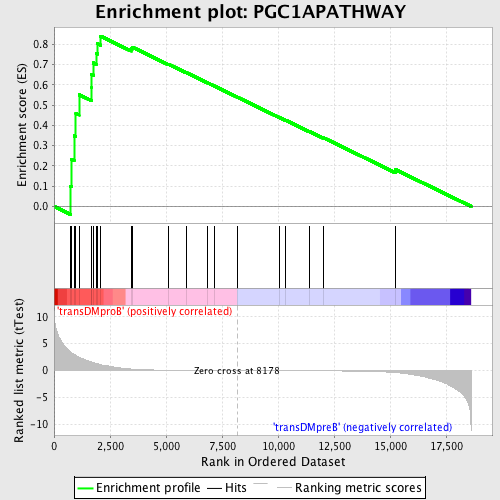
Profile of the Running ES Score & Positions of GeneSet Members on the Rank Ordered List
| Dataset | Set_04_transDMproB_versus_transDMpreB.phenotype_transDMproB_versus_transDMpreB.cls #transDMproB_versus_transDMpreB.phenotype_transDMproB_versus_transDMpreB.cls #transDMproB_versus_transDMpreB_repos |
| Phenotype | phenotype_transDMproB_versus_transDMpreB.cls#transDMproB_versus_transDMpreB_repos |
| Upregulated in class | transDMproB |
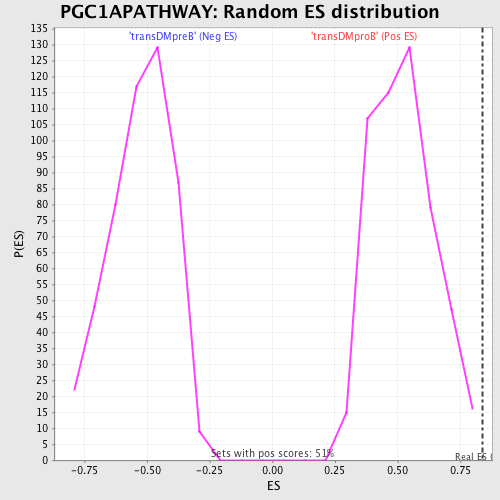
| GeneSet | PGC1APATHWAY |
| Enrichment Score (ES) | 0.83973074 |
| Normalized Enrichment Score (NES) | 1.6092188 |
| Nominal p-value | 0.0 |
| FDR q-value | 0.66003585 |
| FWER p-Value | 0.404 |
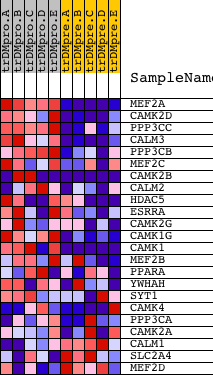
| PROBE | DESCRIPTION (from dataset) | GENE SYMBOL | GENE_TITLE | RANK IN GENE LIST | RANK METRIC SCORE | RUNNING ES | CORE ENRICHMENT | |
|---|---|---|---|---|---|---|---|---|
| 1 | MEF2A | 1201 5089 3492 | 738 | 3.451 | 0.1003 | Yes | ||
| 2 | CAMK2D | 4232 | 775 | 3.295 | 0.2319 | Yes | ||
| 3 | PPP3CC | 21763 | 894 | 3.021 | 0.3481 | Yes | ||
| 4 | CALM3 | 8682 | 973 | 2.818 | 0.4582 | Yes | ||
| 5 | PPP3CB | 5285 | 1113 | 2.475 | 0.5511 | Yes | ||
| 6 | MEF2C | 3204 9378 | 1666 | 1.612 | 0.5868 | Yes | ||
| 7 | CAMK2B | 20536 | 1673 | 1.604 | 0.6515 | Yes | ||
| 8 | CALM2 | 8681 | 1752 | 1.490 | 0.7077 | Yes | ||
| 9 | HDAC5 | 1480 20205 | 1878 | 1.318 | 0.7544 | Yes | ||
| 10 | ESRRA | 23802 | 1937 | 1.252 | 0.8021 | Yes | ||
| 11 | CAMK2G | 21905 | 2068 | 1.101 | 0.8397 | Yes | ||
| 12 | CAMK1G | 13710 4129 | 3435 | 0.278 | 0.7775 | No | ||
| 13 | CAMK1 | 1037 1170 17044 | 3479 | 0.265 | 0.7860 | No | ||
| 14 | MEF2B | 9377 | 5095 | 0.060 | 0.7015 | No | ||
| 15 | PPARA | 22397 | 5892 | 0.036 | 0.6602 | No | ||
| 16 | YWHAH | 5937 10368 | 6854 | 0.019 | 0.6093 | No | ||
| 17 | SYT1 | 5565 | 7160 | 0.014 | 0.5935 | No | ||
| 18 | CAMK4 | 4473 | 8169 | 0.000 | 0.5393 | No | ||
| 19 | PPP3CA | 1863 5284 | 10076 | -0.024 | 0.4377 | No | ||
| 20 | CAMK2A | 2024 23541 1980 | 10344 | -0.028 | 0.4245 | No | ||
| 21 | CALM1 | 21184 | 11385 | -0.046 | 0.3705 | No | ||
| 22 | SLC2A4 | 20380 | 12032 | -0.062 | 0.3382 | No | ||
| 23 | MEF2D | 9379 | 15241 | -0.390 | 0.1815 | No |