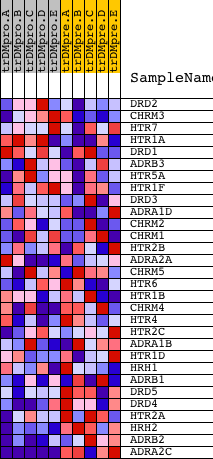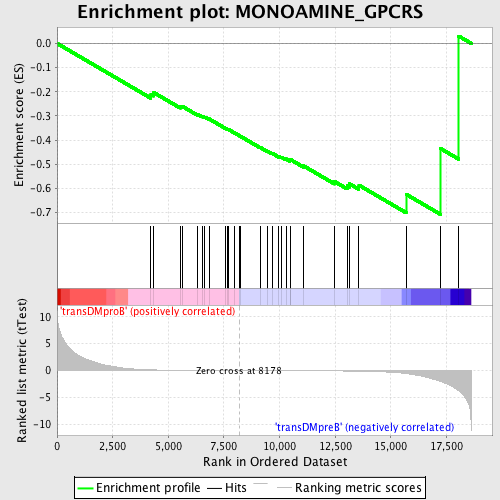
Profile of the Running ES Score & Positions of GeneSet Members on the Rank Ordered List
| Dataset | Set_04_transDMproB_versus_transDMpreB.phenotype_transDMproB_versus_transDMpreB.cls #transDMproB_versus_transDMpreB.phenotype_transDMproB_versus_transDMpreB.cls #transDMproB_versus_transDMpreB_repos |
| Phenotype | phenotype_transDMproB_versus_transDMpreB.cls#transDMproB_versus_transDMpreB_repos |
| Upregulated in class | transDMpreB |
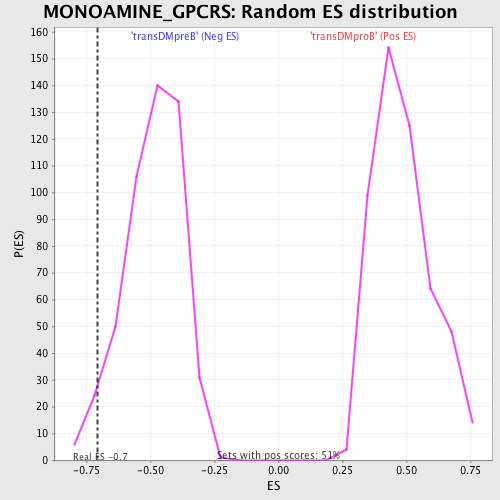
| GeneSet | MONOAMINE_GPCRS |
| Enrichment Score (ES) | -0.7080482 |
| Normalized Enrichment Score (NES) | -1.4525936 |
| Nominal p-value | 0.034552846 |
| FDR q-value | 0.22359438 |
| FWER p-Value | 0.999 |
| PROBE | DESCRIPTION (from dataset) | GENE SYMBOL | GENE_TITLE | RANK IN GENE LIST | RANK METRIC SCORE | RUNNING ES | CORE ENRICHMENT | |
|---|---|---|---|---|---|---|---|---|
| 1 | DRD2 | 19461 | 4217 | 0.120 | -0.2108 | No | ||
| 2 | CHRM3 | 21547 | 4346 | 0.106 | -0.2035 | No | ||
| 3 | HTR7 | 23690 | 5535 | 0.046 | -0.2613 | No | ||
| 4 | HTR1A | 21569 | 5645 | 0.043 | -0.2615 | No | ||
| 5 | DRD1 | 4638 | 6305 | 0.028 | -0.2932 | No | ||
| 6 | ADRB3 | 18901 | 6518 | 0.024 | -0.3013 | No | ||
| 7 | HTR5A | 16899 | 6646 | 0.022 | -0.3052 | No | ||
| 8 | HTR1F | 22562 | 6830 | 0.019 | -0.3124 | No | ||
| 9 | DRD3 | 22750 | 7576 | 0.009 | -0.3513 | No | ||
| 10 | ADRA1D | 20737 8561 | 7669 | 0.007 | -0.3553 | No | ||
| 11 | CHRM2 | 10840 | 7691 | 0.007 | -0.3555 | No | ||
| 12 | CHRM1 | 23943 | 7972 | 0.003 | -0.3702 | No | ||
| 13 | HTR2B | 13900 | 8212 | -0.000 | -0.3830 | No | ||
| 14 | ADRA2A | 4355 | 8248 | -0.001 | -0.3848 | No | ||
| 15 | CHRM5 | 10038 | 9126 | -0.012 | -0.4304 | No | ||
| 16 | HTR6 | 15698 | 9455 | -0.016 | -0.4459 | No | ||
| 17 | HTR1B | 19051 | 9672 | -0.019 | -0.4550 | No | ||
| 18 | CHRM4 | 14945 | 9972 | -0.023 | -0.4680 | No | ||
| 19 | HTR4 | 1987 4887 | 10087 | -0.024 | -0.4709 | No | ||
| 20 | HTR2C | 24230 | 10291 | -0.027 | -0.4782 | No | ||
| 21 | ADRA1B | 4354 | 10468 | -0.030 | -0.4836 | No | ||
| 22 | HTR1D | 16029 | 10471 | -0.030 | -0.4797 | No | ||
| 23 | HRH1 | 17321 | 11077 | -0.040 | -0.5068 | No | ||
| 24 | ADRB1 | 4357 | 12474 | -0.075 | -0.5719 | No | ||
| 25 | DRD5 | 16853 | 13041 | -0.097 | -0.5893 | No | ||
| 26 | DRD4 | 4639 | 13138 | -0.102 | -0.5809 | No | ||
| 27 | HTR2A | 9135 21961 | 13567 | -0.127 | -0.5869 | No | ||
| 28 | HRH2 | 9120 | 15690 | -0.570 | -0.6245 | Yes | ||
| 29 | ADRB2 | 23422 | 17243 | -2.032 | -0.4356 | Yes | ||
| 30 | ADRA2C | 16869 | 18054 | -3.799 | 0.0302 | Yes |