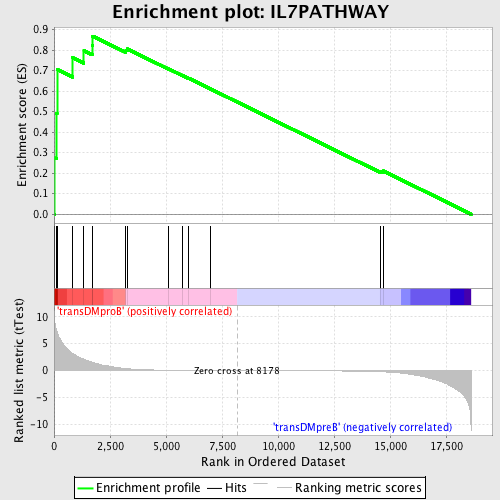
Profile of the Running ES Score & Positions of GeneSet Members on the Rank Ordered List
| Dataset | Set_04_transDMproB_versus_transDMpreB.phenotype_transDMproB_versus_transDMpreB.cls #transDMproB_versus_transDMpreB.phenotype_transDMproB_versus_transDMpreB.cls #transDMproB_versus_transDMpreB_repos |
| Phenotype | phenotype_transDMproB_versus_transDMpreB.cls#transDMproB_versus_transDMpreB_repos |
| Upregulated in class | transDMproB |
| GeneSet | IL7PATHWAY |
| Enrichment Score (ES) | 0.86815524 |
| Normalized Enrichment Score (NES) | 1.5664587 |
| Nominal p-value | 0.0019569471 |
| FDR q-value | 0.21918659 |
| FWER p-Value | 0.711 |
| PROBE | DESCRIPTION (from dataset) | GENE SYMBOL | GENE_TITLE | RANK IN GENE LIST | RANK METRIC SCORE | RUNNING ES | CORE ENRICHMENT | |
|---|---|---|---|---|---|---|---|---|
| 1 | LCK | 15746 | 27 | 9.283 | 0.2742 | Yes | ||
| 2 | IL7R | 9175 4922 | 113 | 7.459 | 0.4911 | Yes | ||
| 3 | JAK3 | 9198 4936 | 133 | 7.251 | 0.7054 | Yes | ||
| 4 | STAT5A | 20664 | 824 | 3.180 | 0.7628 | Yes | ||
| 5 | JAK1 | 15827 | 1333 | 2.074 | 0.7971 | Yes | ||
| 6 | PTK2B | 21776 | 1704 | 1.562 | 0.8236 | Yes | ||
| 7 | CREBBP | 22682 8783 | 1722 | 1.533 | 0.8682 | Yes | ||
| 8 | FYN | 3375 3395 20052 | 3206 | 0.359 | 0.7991 | No | ||
| 9 | IL7 | 4921 | 3269 | 0.334 | 0.8057 | No | ||
| 10 | PIK3R1 | 3170 | 5108 | 0.059 | 0.7086 | No | ||
| 11 | PIK3CA | 9562 | 5729 | 0.040 | 0.6765 | No | ||
| 12 | STAT5B | 20222 | 5983 | 0.035 | 0.6639 | No | ||
| 13 | NMI | 14590 | 6979 | 0.017 | 0.6109 | No | ||
| 14 | BCL2 | 8651 3928 13864 4435 981 4062 13863 4027 | 14565 | -0.235 | 0.2102 | No | ||
| 15 | IL2RG | 24096 | 14693 | -0.254 | 0.2109 | No |

