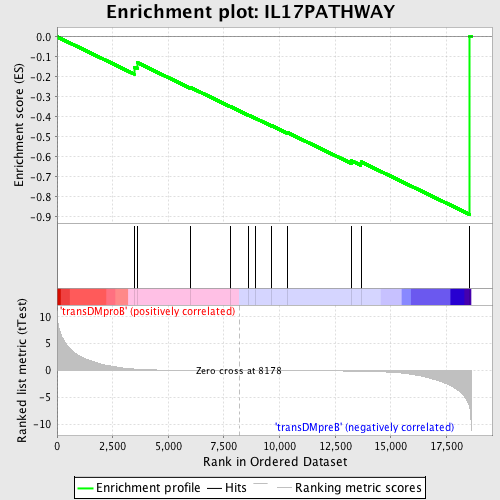
Profile of the Running ES Score & Positions of GeneSet Members on the Rank Ordered List
| Dataset | Set_04_transDMproB_versus_transDMpreB.phenotype_transDMproB_versus_transDMpreB.cls #transDMproB_versus_transDMpreB.phenotype_transDMproB_versus_transDMpreB.cls #transDMproB_versus_transDMpreB_repos |
| Phenotype | phenotype_transDMproB_versus_transDMpreB.cls#transDMproB_versus_transDMpreB_repos |
| Upregulated in class | transDMpreB |
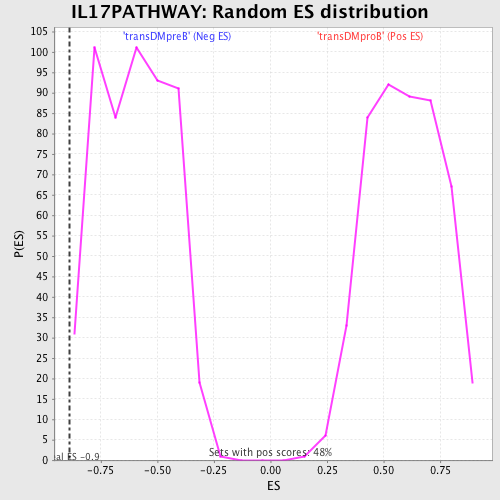
| GeneSet | IL17PATHWAY |
| Enrichment Score (ES) | -0.88780177 |
| Normalized Enrichment Score (NES) | -1.4836694 |
| Nominal p-value | 0.011516315 |
| FDR q-value | 0.18940234 |
| FWER p-Value | 0.983 |
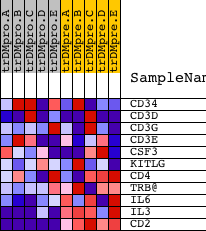
| PROBE | DESCRIPTION (from dataset) | GENE SYMBOL | GENE_TITLE | RANK IN GENE LIST | RANK METRIC SCORE | RUNNING ES | CORE ENRICHMENT | |
|---|---|---|---|---|---|---|---|---|
| 1 | CD34 | 14006 | 3464 | 0.268 | -0.1516 | No | ||
| 2 | CD3D | 19473 | 3602 | 0.234 | -0.1288 | No | ||
| 3 | CD3G | 19139 | 6008 | 0.034 | -0.2537 | No | ||
| 4 | CD3E | 8714 | 7771 | 0.006 | -0.3477 | No | ||
| 5 | CSF3 | 1394 20671 | 8594 | -0.005 | -0.3912 | No | ||
| 6 | KITLG | 19889 3342 | 8902 | -0.009 | -0.4065 | No | ||
| 7 | CD4 | 16999 | 9643 | -0.018 | -0.4439 | No | ||
| 8 | TRB@ | 1157 | 10351 | -0.028 | -0.4783 | No | ||
| 9 | IL6 | 16895 | 13234 | -0.106 | -0.6195 | No | ||
| 10 | IL3 | 20453 | 13659 | -0.135 | -0.6249 | Yes | ||
| 11 | CD2 | 15223 | 18551 | -6.925 | 0.0035 | Yes |