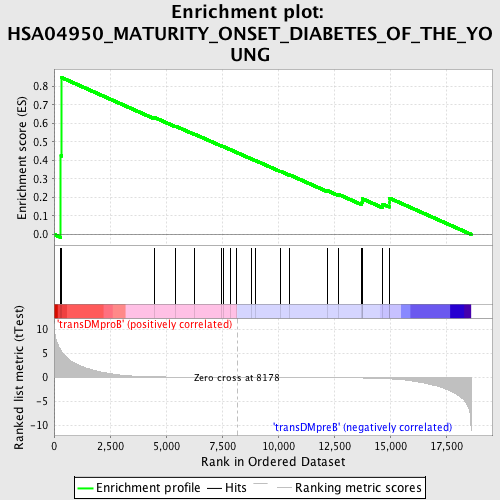
Profile of the Running ES Score & Positions of GeneSet Members on the Rank Ordered List
| Dataset | Set_04_transDMproB_versus_transDMpreB.phenotype_transDMproB_versus_transDMpreB.cls #transDMproB_versus_transDMpreB.phenotype_transDMproB_versus_transDMpreB.cls #transDMproB_versus_transDMpreB_repos |
| Phenotype | phenotype_transDMproB_versus_transDMpreB.cls#transDMproB_versus_transDMpreB_repos |
| Upregulated in class | transDMproB |
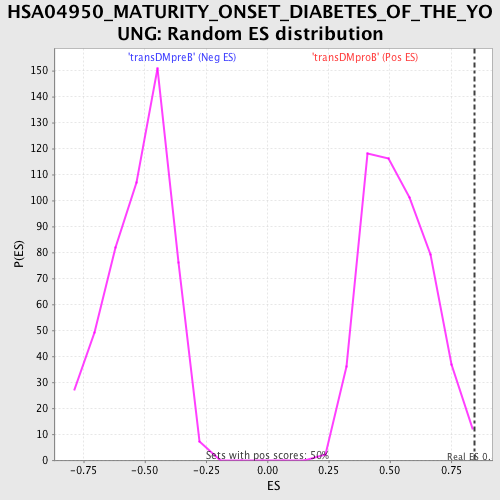
| GeneSet | HSA04950_MATURITY_ONSET_DIABETES_OF_THE_YOUNG |
| Enrichment Score (ES) | 0.8470706 |
| Normalized Enrichment Score (NES) | 1.5933471 |
| Nominal p-value | 0.003992016 |
| FDR q-value | 0.4567613 |
| FWER p-Value | 0.513 |
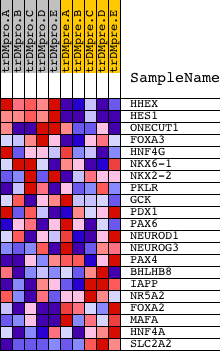
| PROBE | DESCRIPTION (from dataset) | GENE SYMBOL | GENE_TITLE | RANK IN GENE LIST | RANK METRIC SCORE | RUNNING ES | CORE ENRICHMENT | |
|---|---|---|---|---|---|---|---|---|
| 1 | HHEX | 23872 | 306 | 5.589 | 0.4248 | Yes | ||
| 2 | HES1 | 22798 | 336 | 5.368 | 0.8471 | Yes | ||
| 3 | ONECUT1 | 4858 | 4486 | 0.093 | 0.6313 | No | ||
| 4 | FOXA3 | 17949 | 5437 | 0.048 | 0.5840 | No | ||
| 5 | HNF4G | 15640 | 6286 | 0.028 | 0.5407 | No | ||
| 6 | NKX6-1 | 16463 | 7463 | 0.010 | 0.4782 | No | ||
| 7 | NKX2-2 | 5176 | 7542 | 0.009 | 0.4748 | No | ||
| 8 | PKLR | 1850 15545 | 7870 | 0.004 | 0.4575 | No | ||
| 9 | GCK | 20535 | 8153 | 0.000 | 0.4424 | No | ||
| 10 | PDX1 | 16621 | 8805 | -0.008 | 0.4080 | No | ||
| 11 | PAX6 | 5223 | 9000 | -0.010 | 0.3984 | No | ||
| 12 | NEUROD1 | 14550 | 10110 | -0.025 | 0.3407 | No | ||
| 13 | NEUROG3 | 20005 | 10519 | -0.031 | 0.3212 | No | ||
| 14 | PAX4 | 17199 | 12215 | -0.067 | 0.2354 | No | ||
| 15 | BHLHB8 | 9390 5101 12776 | 12682 | -0.083 | 0.2168 | No | ||
| 16 | IAPP | 17249 | 13741 | -0.141 | 0.1710 | No | ||
| 17 | NR5A2 | 4105 13817 | 13753 | -0.142 | 0.1816 | No | ||
| 18 | FOXA2 | 14405 2889 | 13754 | -0.142 | 0.1928 | No | ||
| 19 | MAFA | 11708 | 14673 | -0.252 | 0.1633 | No | ||
| 20 | HNF4A | 14746 | 14960 | -0.307 | 0.1722 | No | ||
| 21 | SLC2A2 | 15623 1880 1855 | 14966 | -0.309 | 0.1963 | No |