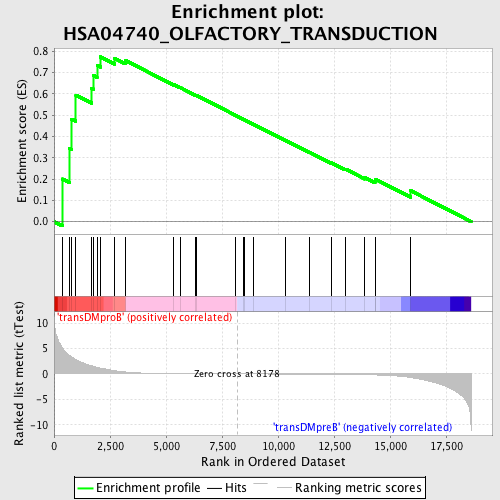
Profile of the Running ES Score & Positions of GeneSet Members on the Rank Ordered List
| Dataset | Set_04_transDMproB_versus_transDMpreB.phenotype_transDMproB_versus_transDMpreB.cls #transDMproB_versus_transDMpreB.phenotype_transDMproB_versus_transDMpreB.cls #transDMproB_versus_transDMpreB_repos |
| Phenotype | phenotype_transDMproB_versus_transDMpreB.cls#transDMproB_versus_transDMpreB_repos |
| Upregulated in class | transDMproB |
| GeneSet | HSA04740_OLFACTORY_TRANSDUCTION |
| Enrichment Score (ES) | 0.77358586 |
| Normalized Enrichment Score (NES) | 1.523476 |
| Nominal p-value | 0.011627907 |
| FDR q-value | 0.25096366 |
| FWER p-Value | 0.914 |

| PROBE | DESCRIPTION (from dataset) | GENE SYMBOL | GENE_TITLE | RANK IN GENE LIST | RANK METRIC SCORE | RUNNING ES | CORE ENRICHMENT | |
|---|---|---|---|---|---|---|---|---|
| 1 | PRKACB | 15140 | 377 | 5.058 | 0.2003 | Yes | ||
| 2 | GUCA1A | 22952 | 680 | 3.643 | 0.3429 | Yes | ||
| 3 | CAMK2D | 4232 | 775 | 3.295 | 0.4815 | Yes | ||
| 4 | CALM3 | 8682 | 973 | 2.818 | 0.5938 | Yes | ||
| 5 | CAMK2B | 20536 | 1673 | 1.604 | 0.6261 | Yes | ||
| 6 | CALM2 | 8681 | 1752 | 1.490 | 0.6869 | Yes | ||
| 7 | ARRB2 | 20806 | 1919 | 1.273 | 0.7335 | Yes | ||
| 8 | CAMK2G | 21905 | 2068 | 1.101 | 0.7736 | Yes | ||
| 9 | GUCA1C | 4761 | 2703 | 0.622 | 0.7666 | No | ||
| 10 | CNGB1 | 18784 | 3196 | 0.362 | 0.7559 | No | ||
| 11 | CNGA3 | 8758 4535 | 5336 | 0.052 | 0.6432 | No | ||
| 12 | PRKACA | 18549 3844 | 5625 | 0.043 | 0.6295 | No | ||
| 13 | PRKX | 9619 5290 | 6319 | 0.028 | 0.5935 | No | ||
| 14 | ADRBK2 | 11499 | 6353 | 0.027 | 0.5929 | No | ||
| 15 | CLCA1 | 15149 | 8086 | 0.001 | 0.4998 | No | ||
| 16 | PRKG1 | 5289 | 8458 | -0.004 | 0.4800 | No | ||
| 17 | PDE1C | 5235 | 8497 | -0.004 | 0.4781 | No | ||
| 18 | CLCA4 | 6041 | 8900 | -0.009 | 0.4569 | No | ||
| 19 | CAMK2A | 2024 23541 1980 | 10344 | -0.028 | 0.3805 | No | ||
| 20 | CALM1 | 21184 | 11385 | -0.046 | 0.3266 | No | ||
| 21 | ADCY3 | 21329 894 | 12389 | -0.072 | 0.2758 | No | ||
| 22 | GUCA1B | 23211 | 13006 | -0.095 | 0.2468 | No | ||
| 23 | CLCA2 | 15148 | 13875 | -0.153 | 0.2068 | No | ||
| 24 | PRKG2 | 74 | 14327 | -0.200 | 0.1912 | No | ||
| 25 | PDC | 4046 14102 | 14355 | -0.204 | 0.1987 | No | ||
| 26 | CALML3 | 21553 | 15913 | -0.699 | 0.1454 | No |

