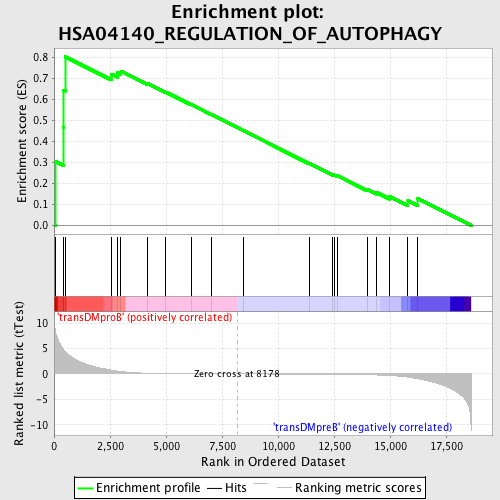
Profile of the Running ES Score & Positions of GeneSet Members on the Rank Ordered List
| Dataset | Set_04_transDMproB_versus_transDMpreB.phenotype_transDMproB_versus_transDMpreB.cls #transDMproB_versus_transDMpreB.phenotype_transDMproB_versus_transDMpreB.cls #transDMproB_versus_transDMpreB_repos |
| Phenotype | phenotype_transDMproB_versus_transDMpreB.cls#transDMproB_versus_transDMpreB_repos |
| Upregulated in class | transDMproB |
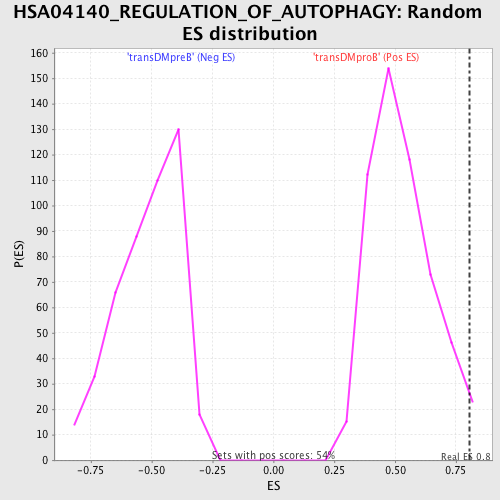
| GeneSet | HSA04140_REGULATION_OF_AUTOPHAGY |
| Enrichment Score (ES) | 0.80396765 |
| Normalized Enrichment Score (NES) | 1.518529 |
| Nominal p-value | 0.025878003 |
| FDR q-value | 0.23351374 |
| FWER p-Value | 0.927 |
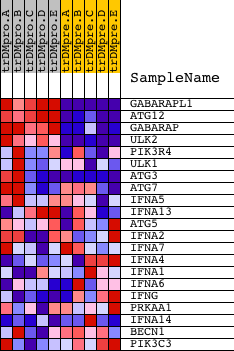
| PROBE | DESCRIPTION (from dataset) | GENE SYMBOL | GENE_TITLE | RANK IN GENE LIST | RANK METRIC SCORE | RUNNING ES | CORE ENRICHMENT | |
|---|---|---|---|---|---|---|---|---|
| 1 | GABARAPL1 | 17268 | 60 | 8.225 | 0.3051 | Yes | ||
| 2 | ATG12 | 12542 | 419 | 4.820 | 0.4665 | Yes | ||
| 3 | GABARAP | 20815 | 431 | 4.781 | 0.6451 | Yes | ||
| 4 | ULK2 | 6617 11384 | 513 | 4.353 | 0.8040 | Yes | ||
| 5 | PIK3R4 | 19333 | 2562 | 0.731 | 0.7212 | No | ||
| 6 | ULK1 | 16436 | 2825 | 0.543 | 0.7275 | No | ||
| 7 | ATG3 | 22740 12587 | 2984 | 0.463 | 0.7363 | No | ||
| 8 | ATG7 | 17320 | 4179 | 0.126 | 0.6769 | No | ||
| 9 | IFNA5 | 9151 | 4988 | 0.063 | 0.6358 | No | ||
| 10 | IFNA13 | 15844 | 6114 | 0.032 | 0.5765 | No | ||
| 11 | ATG5 | 20036 3434 | 7011 | 0.016 | 0.5289 | No | ||
| 12 | IFNA2 | 9149 | 8474 | -0.004 | 0.4505 | No | ||
| 13 | IFNA7 | 9152 | 11389 | -0.046 | 0.2955 | No | ||
| 14 | IFNA4 | 9150 | 12444 | -0.074 | 0.2416 | No | ||
| 15 | IFNA1 | 9147 | 12528 | -0.077 | 0.2400 | No | ||
| 16 | IFNA6 | 17749 | 12633 | -0.081 | 0.2375 | No | ||
| 17 | IFNG | 19869 | 14005 | -0.166 | 0.1700 | No | ||
| 18 | PRKAA1 | 22520 | 14394 | -0.209 | 0.1569 | No | ||
| 19 | IFNA14 | 11917 | 14983 | -0.313 | 0.1370 | No | ||
| 20 | BECN1 | 7077 | 15795 | -0.625 | 0.1169 | No | ||
| 21 | PIK3C3 | 23607 | 16209 | -0.928 | 0.1294 | No |