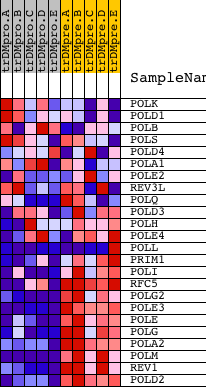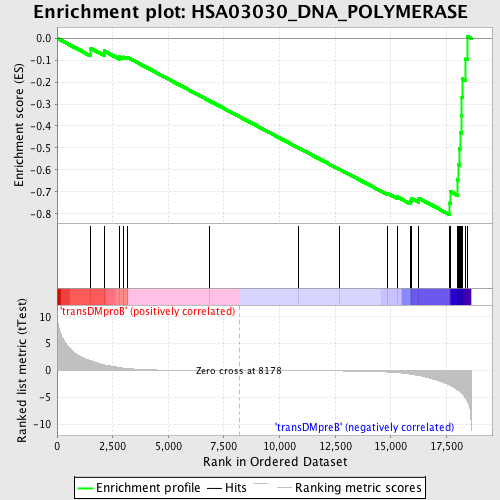
Profile of the Running ES Score & Positions of GeneSet Members on the Rank Ordered List
| Dataset | Set_04_transDMproB_versus_transDMpreB.phenotype_transDMproB_versus_transDMpreB.cls #transDMproB_versus_transDMpreB.phenotype_transDMproB_versus_transDMpreB.cls #transDMproB_versus_transDMpreB_repos |
| Phenotype | phenotype_transDMproB_versus_transDMpreB.cls#transDMproB_versus_transDMpreB_repos |
| Upregulated in class | transDMpreB |
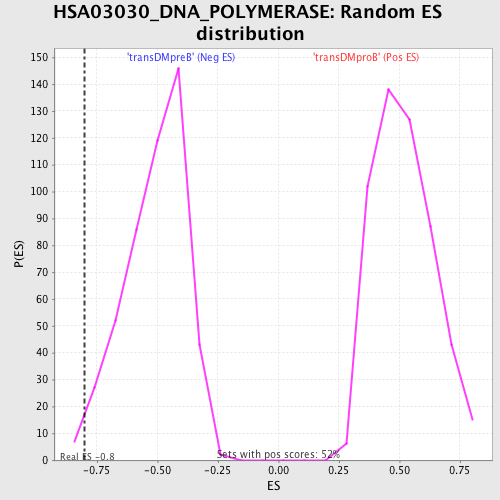
| GeneSet | HSA03030_DNA_POLYMERASE |
| Enrichment Score (ES) | -0.8034233 |
| Normalized Enrichment Score (NES) | -1.5761437 |
| Nominal p-value | 0.012448133 |
| FDR q-value | 0.09203411 |
| FWER p-Value | 0.602 |
| PROBE | DESCRIPTION (from dataset) | GENE SYMBOL | GENE_TITLE | RANK IN GENE LIST | RANK METRIC SCORE | RUNNING ES | CORE ENRICHMENT | |
|---|---|---|---|---|---|---|---|---|
| 1 | POLK | 21384 | 1488 | 1.827 | -0.0448 | No | ||
| 2 | POLD1 | 17847 | 2113 | 1.052 | -0.0580 | No | ||
| 3 | POLB | 9599 | 2809 | 0.551 | -0.0847 | No | ||
| 4 | POLS | 9963 | 2990 | 0.458 | -0.0856 | No | ||
| 5 | POLD4 | 12822 | 3141 | 0.386 | -0.0862 | No | ||
| 6 | POLA1 | 24112 | 6832 | 0.019 | -0.2843 | No | ||
| 7 | POLE2 | 21053 | 10840 | -0.036 | -0.4991 | No | ||
| 8 | REV3L | 20050 | 12689 | -0.083 | -0.5969 | No | ||
| 9 | POLQ | 13407 22768 | 14850 | -0.283 | -0.7076 | No | ||
| 10 | POLD3 | 17742 | 15292 | -0.408 | -0.7234 | No | ||
| 11 | POLH | 22966 | 15875 | -0.676 | -0.7417 | No | ||
| 12 | POLE4 | 12441 | 15943 | -0.724 | -0.7313 | No | ||
| 13 | POLL | 23658 3688 | 16240 | -0.961 | -0.7287 | No | ||
| 14 | PRIM1 | 19847 | 17631 | -2.714 | -0.7510 | Yes | ||
| 15 | POLI | 23410 | 17682 | -2.820 | -0.6993 | Yes | ||
| 16 | RFC5 | 13005 7791 | 18005 | -3.668 | -0.6458 | Yes | ||
| 17 | POLG2 | 20180 | 18020 | -3.703 | -0.5750 | Yes | ||
| 18 | POLE3 | 7200 | 18084 | -3.862 | -0.5038 | Yes | ||
| 19 | POLE | 16755 | 18111 | -3.955 | -0.4289 | Yes | ||
| 20 | POLG | 17789 | 18186 | -4.245 | -0.3509 | Yes | ||
| 21 | POLA2 | 23988 | 18195 | -4.278 | -0.2687 | Yes | ||
| 22 | POLM | 20538 | 18213 | -4.351 | -0.1856 | Yes | ||
| 23 | REV1 | 13971 | 18363 | -5.128 | -0.0946 | Yes | ||
| 24 | POLD2 | 20537 | 18438 | -5.603 | 0.0096 | Yes |