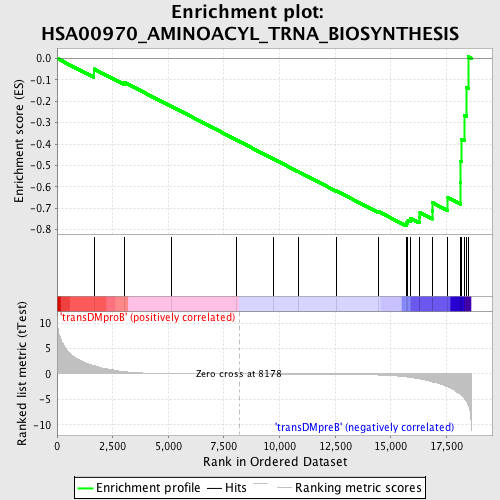
Profile of the Running ES Score & Positions of GeneSet Members on the Rank Ordered List
| Dataset | Set_04_transDMproB_versus_transDMpreB.phenotype_transDMproB_versus_transDMpreB.cls #transDMproB_versus_transDMpreB.phenotype_transDMproB_versus_transDMpreB.cls #transDMproB_versus_transDMpreB_repos |
| Phenotype | phenotype_transDMproB_versus_transDMpreB.cls#transDMproB_versus_transDMpreB_repos |
| Upregulated in class | transDMpreB |
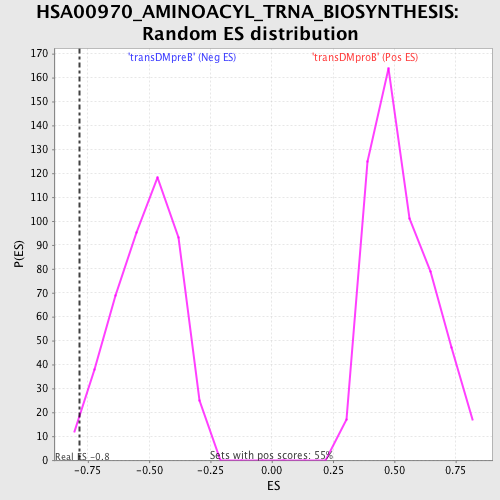
| GeneSet | HSA00970_AMINOACYL_TRNA_BIOSYNTHESIS |
| Enrichment Score (ES) | -0.78292286 |
| Normalized Enrichment Score (NES) | -1.5293304 |
| Nominal p-value | 0.017777778 |
| FDR q-value | 0.13133155 |
| FWER p-Value | 0.897 |
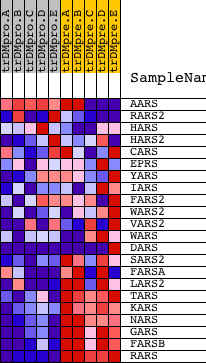
| PROBE | DESCRIPTION (from dataset) | GENE SYMBOL | GENE_TITLE | RANK IN GENE LIST | RANK METRIC SCORE | RUNNING ES | CORE ENRICHMENT | |
|---|---|---|---|---|---|---|---|---|
| 1 | AARS | 10630 6151 | 1658 | 1.625 | -0.0493 | No | ||
| 2 | RARS2 | 16247 2490 2411 | 3017 | 0.448 | -0.1113 | No | ||
| 3 | HARS | 23451 | 5159 | 0.058 | -0.2251 | No | ||
| 4 | HARS2 | 23592 14820 | 8044 | 0.002 | -0.3801 | No | ||
| 5 | CARS | 1683 17544 | 9714 | -0.019 | -0.4694 | No | ||
| 6 | EPRS | 14014 | 10848 | -0.036 | -0.5294 | No | ||
| 7 | YARS | 16071 | 12538 | -0.078 | -0.6184 | No | ||
| 8 | IARS | 4190 8361 8362 | 14448 | -0.217 | -0.7157 | No | ||
| 9 | FARS2 | 21666 | 15699 | -0.576 | -0.7688 | Yes | ||
| 10 | WARS2 | 12884 7688 | 15771 | -0.614 | -0.7575 | Yes | ||
| 11 | VARS2 | 23265 1595 7588 | 15870 | -0.674 | -0.7463 | Yes | ||
| 12 | WARS | 2085 20984 | 16287 | -0.993 | -0.7443 | Yes | ||
| 13 | DARS | 10375 13846 | 16309 | -0.999 | -0.7209 | Yes | ||
| 14 | SARS2 | 5 | 16859 | -1.559 | -0.7122 | Yes | ||
| 15 | FARSA | 7311 | 16877 | -1.577 | -0.6744 | Yes | ||
| 16 | LARS2 | 19255 | 17541 | -2.496 | -0.6488 | Yes | ||
| 17 | TARS | 22325 8502 | 18141 | -4.105 | -0.5803 | Yes | ||
| 18 | KARS | 18738 | 18148 | -4.127 | -0.4794 | Yes | ||
| 19 | NARS | 23418 | 18178 | -4.222 | -0.3774 | Yes | ||
| 20 | GARS | 17438 | 18321 | -4.883 | -0.2652 | Yes | ||
| 21 | FARSB | 13909 | 18409 | -5.403 | -0.1374 | Yes | ||
| 22 | RARS | 20496 | 18480 | -6.052 | 0.0073 | Yes |