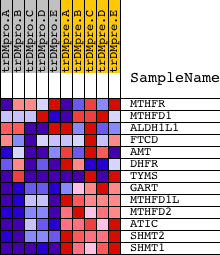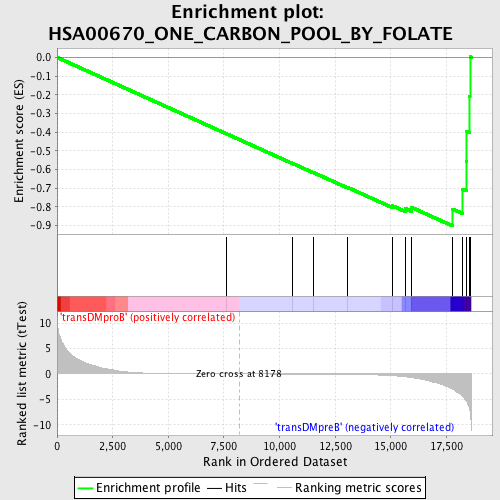
Profile of the Running ES Score & Positions of GeneSet Members on the Rank Ordered List
| Dataset | Set_04_transDMproB_versus_transDMpreB.phenotype_transDMproB_versus_transDMpreB.cls #transDMproB_versus_transDMpreB.phenotype_transDMproB_versus_transDMpreB.cls #transDMproB_versus_transDMpreB_repos |
| Phenotype | phenotype_transDMproB_versus_transDMpreB.cls#transDMproB_versus_transDMpreB_repos |
| Upregulated in class | transDMpreB |
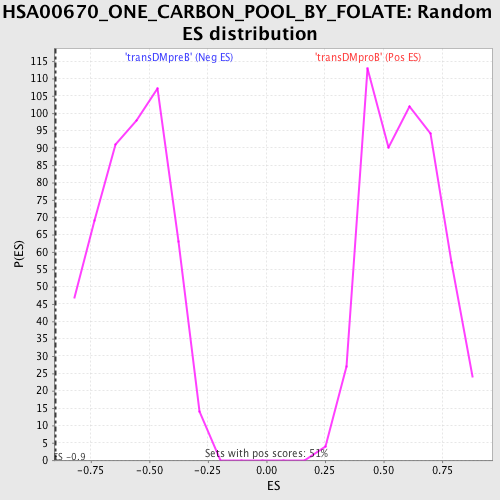
| GeneSet | HSA00670_ONE_CARBON_POOL_BY_FOLATE |
| Enrichment Score (ES) | -0.9025503 |
| Normalized Enrichment Score (NES) | -1.5786837 |
| Nominal p-value | 0.0 |
| FDR q-value | 0.10197305 |
| FWER p-Value | 0.588 |
| PROBE | DESCRIPTION (from dataset) | GENE SYMBOL | GENE_TITLE | RANK IN GENE LIST | RANK METRIC SCORE | RUNNING ES | CORE ENRICHMENT | |
|---|---|---|---|---|---|---|---|---|
| 1 | MTHFR | 5130 | 7610 | 0.008 | -0.4088 | No | ||
| 2 | MTHFD1 | 2132 21238 | 10576 | -0.032 | -0.5672 | No | ||
| 3 | ALDH1L1 | 17358 1014 | 11515 | -0.049 | -0.6162 | No | ||
| 4 | FTCD | 3390 19979 | 13038 | -0.097 | -0.6951 | No | ||
| 5 | AMT | 322 | 15074 | -0.339 | -0.7945 | No | ||
| 6 | DHFR | 21590 | 15647 | -0.550 | -0.8089 | No | ||
| 7 | TYMS | 5810 5809 3606 3598 | 15922 | -0.710 | -0.8026 | No | ||
| 8 | GART | 22543 1754 | 17782 | -3.046 | -0.8123 | Yes | ||
| 9 | MTHFD1L | 11300 | 18226 | -4.434 | -0.7048 | Yes | ||
| 10 | MTHFD2 | 17100 | 18397 | -5.326 | -0.5562 | Yes | ||
| 11 | ATIC | 14231 3968 | 18414 | -5.446 | -0.3958 | Yes | ||
| 12 | SHMT2 | 3307 19601 | 18529 | -6.569 | -0.2073 | Yes | ||
| 13 | SHMT1 | 5431 | 18559 | -7.157 | 0.0031 | Yes |