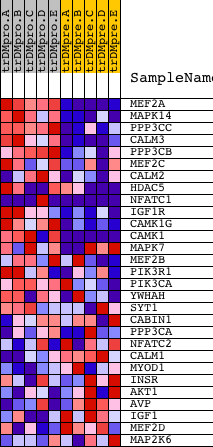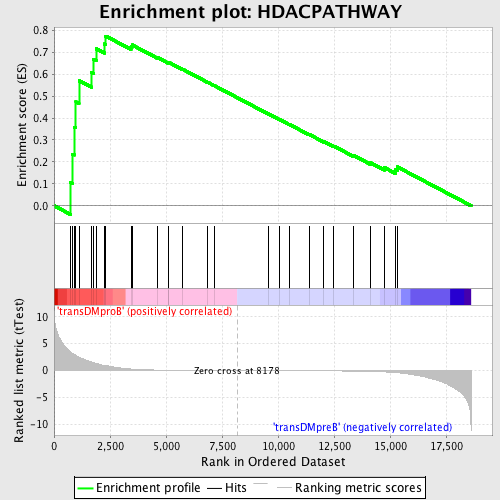
Profile of the Running ES Score & Positions of GeneSet Members on the Rank Ordered List
| Dataset | Set_04_transDMproB_versus_transDMpreB.phenotype_transDMproB_versus_transDMpreB.cls #transDMproB_versus_transDMpreB.phenotype_transDMproB_versus_transDMpreB.cls #transDMproB_versus_transDMpreB_repos |
| Phenotype | phenotype_transDMproB_versus_transDMpreB.cls#transDMproB_versus_transDMpreB_repos |
| Upregulated in class | transDMproB |
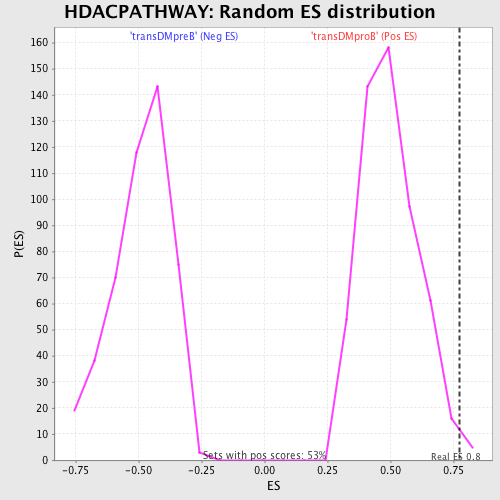
| GeneSet | HDACPATHWAY |
| Enrichment Score (ES) | 0.7737417 |
| Normalized Enrichment Score (NES) | 1.5566813 |
| Nominal p-value | 0.0093632955 |
| FDR q-value | 0.22937724 |
| FWER p-Value | 0.777 |
| PROBE | DESCRIPTION (from dataset) | GENE SYMBOL | GENE_TITLE | RANK IN GENE LIST | RANK METRIC SCORE | RUNNING ES | CORE ENRICHMENT | |
|---|---|---|---|---|---|---|---|---|
| 1 | MEF2A | 1201 5089 3492 | 738 | 3.451 | 0.1059 | Yes | ||
| 2 | MAPK14 | 23313 | 828 | 3.176 | 0.2350 | Yes | ||
| 3 | PPP3CC | 21763 | 894 | 3.021 | 0.3589 | Yes | ||
| 4 | CALM3 | 8682 | 973 | 2.818 | 0.4736 | Yes | ||
| 5 | PPP3CB | 5285 | 1113 | 2.475 | 0.5705 | Yes | ||
| 6 | MEF2C | 3204 9378 | 1666 | 1.612 | 0.6088 | Yes | ||
| 7 | CALM2 | 8681 | 1752 | 1.490 | 0.6671 | Yes | ||
| 8 | HDAC5 | 1480 20205 | 1878 | 1.318 | 0.7159 | Yes | ||
| 9 | NFATC1 | 23398 1999 5167 9455 1985 1957 | 2241 | 0.988 | 0.7381 | Yes | ||
| 10 | IGF1R | 9157 | 2306 | 0.927 | 0.7737 | Yes | ||
| 11 | CAMK1G | 13710 4129 | 3435 | 0.278 | 0.7248 | No | ||
| 12 | CAMK1 | 1037 1170 17044 | 3479 | 0.265 | 0.7337 | No | ||
| 13 | MAPK7 | 1381 20414 | 4612 | 0.084 | 0.6763 | No | ||
| 14 | MEF2B | 9377 | 5095 | 0.060 | 0.6529 | No | ||
| 15 | PIK3R1 | 3170 | 5108 | 0.059 | 0.6547 | No | ||
| 16 | PIK3CA | 9562 | 5729 | 0.040 | 0.6231 | No | ||
| 17 | YWHAH | 5937 10368 | 6854 | 0.019 | 0.5634 | No | ||
| 18 | SYT1 | 5565 | 7160 | 0.014 | 0.5476 | No | ||
| 19 | CABIN1 | 19733 | 9585 | -0.018 | 0.4179 | No | ||
| 20 | PPP3CA | 1863 5284 | 10076 | -0.024 | 0.3926 | No | ||
| 21 | NFATC2 | 5168 2866 | 10498 | -0.030 | 0.3712 | No | ||
| 22 | CALM1 | 21184 | 11385 | -0.046 | 0.3255 | No | ||
| 23 | MYOD1 | 18237 | 12040 | -0.062 | 0.2929 | No | ||
| 24 | INSR | 18950 | 12479 | -0.075 | 0.2725 | No | ||
| 25 | AKT1 | 8568 | 13376 | -0.114 | 0.2291 | No | ||
| 26 | AVP | 14428 | 14134 | -0.177 | 0.1958 | No | ||
| 27 | IGF1 | 3352 9156 3409 | 14748 | -0.264 | 0.1740 | No | ||
| 28 | MEF2D | 9379 | 15241 | -0.390 | 0.1640 | No | ||
| 29 | MAP2K6 | 20614 1414 | 15318 | -0.416 | 0.1774 | No |