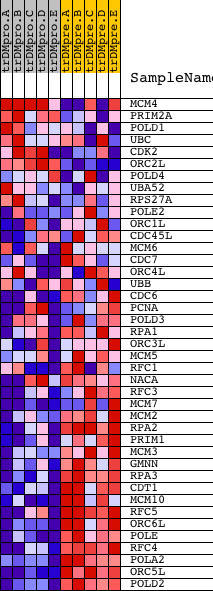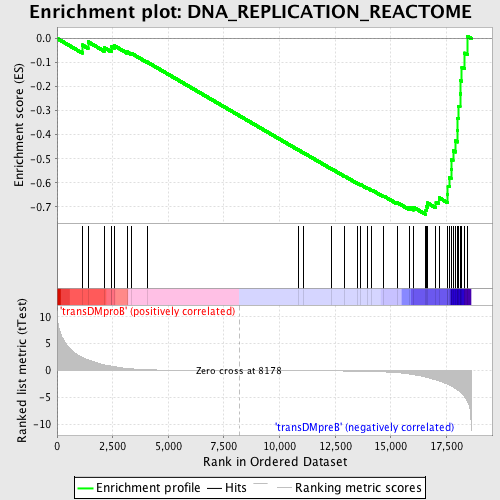
Profile of the Running ES Score & Positions of GeneSet Members on the Rank Ordered List
| Dataset | Set_04_transDMproB_versus_transDMpreB.phenotype_transDMproB_versus_transDMpreB.cls #transDMproB_versus_transDMpreB.phenotype_transDMproB_versus_transDMpreB.cls #transDMproB_versus_transDMpreB_repos |
| Phenotype | phenotype_transDMproB_versus_transDMpreB.cls#transDMproB_versus_transDMpreB_repos |
| Upregulated in class | transDMpreB |
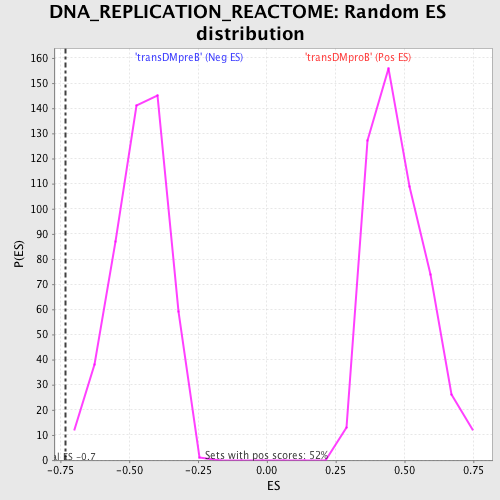
| GeneSet | DNA_REPLICATION_REACTOME |
| Enrichment Score (ES) | -0.7315771 |
| Normalized Enrichment Score (NES) | -1.5876703 |
| Nominal p-value | 0.0020703934 |
| FDR q-value | 0.10118012 |
| FWER p-Value | 0.521 |
| PROBE | DESCRIPTION (from dataset) | GENE SYMBOL | GENE_TITLE | RANK IN GENE LIST | RANK METRIC SCORE | RUNNING ES | CORE ENRICHMENT | |
|---|---|---|---|---|---|---|---|---|
| 1 | MCM4 | 22655 1708 | 1130 | 2.455 | -0.0271 | No | ||
| 2 | PRIM2A | 13986 | 1392 | 1.966 | -0.0141 | No | ||
| 3 | POLD1 | 17847 | 2113 | 1.052 | -0.0385 | No | ||
| 4 | UBC | 14 14 10241 15 16 | 2437 | 0.825 | -0.0445 | No | ||
| 5 | CDK2 | 3438 3373 19592 3322 | 2439 | 0.823 | -0.0333 | No | ||
| 6 | ORC2L | 385 13949 | 2569 | 0.726 | -0.0302 | No | ||
| 7 | POLD4 | 12822 | 3141 | 0.386 | -0.0557 | No | ||
| 8 | UBA52 | 10239 | 3333 | 0.308 | -0.0617 | No | ||
| 9 | RPS27A | 13433 | 4041 | 0.146 | -0.0978 | No | ||
| 10 | POLE2 | 21053 | 10840 | -0.036 | -0.4632 | No | ||
| 11 | ORC1L | 327 16144 | 11076 | -0.040 | -0.4753 | No | ||
| 12 | CDC45L | 22642 1752 | 12352 | -0.071 | -0.5430 | No | ||
| 13 | MCM6 | 4000 13845 4119 | 12928 | -0.092 | -0.5727 | No | ||
| 14 | CDC7 | 16765 3477 | 13490 | -0.121 | -0.6012 | No | ||
| 15 | ORC4L | 11172 6460 | 13642 | -0.133 | -0.6075 | No | ||
| 16 | UBB | 10240 | 13945 | -0.159 | -0.6216 | No | ||
| 17 | CDC6 | 6221 6220 | 14147 | -0.179 | -0.6299 | No | ||
| 18 | PCNA | 9535 | 14678 | -0.252 | -0.6550 | No | ||
| 19 | POLD3 | 17742 | 15292 | -0.408 | -0.6824 | No | ||
| 20 | RPA1 | 20349 | 15833 | -0.646 | -0.7026 | No | ||
| 21 | ORC3L | 6941 | 16029 | -0.786 | -0.7023 | No | ||
| 22 | MCM5 | 18564 | 16574 | -1.223 | -0.7148 | Yes | ||
| 23 | RFC1 | 16527 | 16602 | -1.243 | -0.6991 | Yes | ||
| 24 | NACA | 9444 5147 | 16642 | -1.292 | -0.6835 | Yes | ||
| 25 | RFC3 | 12786 | 17029 | -1.726 | -0.6806 | Yes | ||
| 26 | MCM7 | 9372 3568 | 17165 | -1.899 | -0.6617 | Yes | ||
| 27 | MCM2 | 17074 | 17557 | -2.531 | -0.6480 | Yes | ||
| 28 | RPA2 | 2330 16057 | 17569 | -2.561 | -0.6134 | Yes | ||
| 29 | PRIM1 | 19847 | 17631 | -2.714 | -0.5794 | Yes | ||
| 30 | MCM3 | 13991 | 17710 | -2.887 | -0.5440 | Yes | ||
| 31 | GMNN | 21513 | 17724 | -2.911 | -0.5047 | Yes | ||
| 32 | RPA3 | 12667 | 17797 | -3.079 | -0.4662 | Yes | ||
| 33 | CDT1 | 18437 | 17906 | -3.365 | -0.4258 | Yes | ||
| 34 | MCM10 | 14694 | 17993 | -3.628 | -0.3806 | Yes | ||
| 35 | RFC5 | 13005 7791 | 18005 | -3.668 | -0.3308 | Yes | ||
| 36 | ORC6L | 18539 | 18045 | -3.771 | -0.2811 | Yes | ||
| 37 | POLE | 16755 | 18111 | -3.955 | -0.2302 | Yes | ||
| 38 | RFC4 | 1735 22627 | 18132 | -4.059 | -0.1756 | Yes | ||
| 39 | POLA2 | 23988 | 18195 | -4.278 | -0.1201 | Yes | ||
| 40 | ORC5L | 11173 3595 | 18310 | -4.783 | -0.0606 | Yes | ||
| 41 | POLD2 | 20537 | 18438 | -5.603 | 0.0096 | Yes |