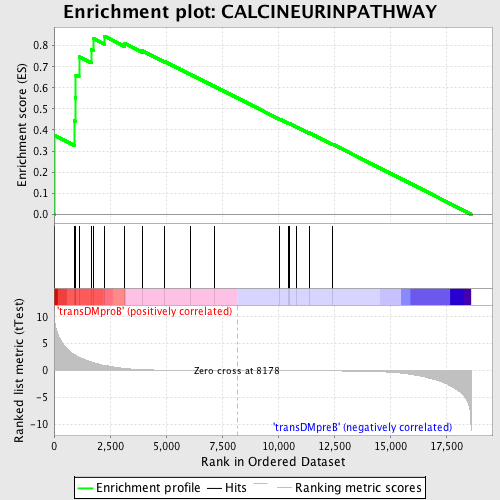
Profile of the Running ES Score & Positions of GeneSet Members on the Rank Ordered List
| Dataset | Set_04_transDMproB_versus_transDMpreB.phenotype_transDMproB_versus_transDMpreB.cls #transDMproB_versus_transDMpreB.phenotype_transDMproB_versus_transDMpreB.cls #transDMproB_versus_transDMpreB_repos |
| Phenotype | phenotype_transDMproB_versus_transDMpreB.cls#transDMproB_versus_transDMpreB_repos |
| Upregulated in class | transDMproB |
| GeneSet | CALCINEURINPATHWAY |
| Enrichment Score (ES) | 0.84527904 |
| Normalized Enrichment Score (NES) | 1.5695453 |
| Nominal p-value | 0.0019455253 |
| FDR q-value | 0.24045056 |
| FWER p-Value | 0.683 |
| PROBE | DESCRIPTION (from dataset) | GENE SYMBOL | GENE_TITLE | RANK IN GENE LIST | RANK METRIC SCORE | RUNNING ES | CORE ENRICHMENT | |
|---|---|---|---|---|---|---|---|---|
| 1 | MARCKS | 9331 | 19 | 9.740 | 0.3747 | Yes | ||
| 2 | PPP3CC | 21763 | 894 | 3.021 | 0.4443 | Yes | ||
| 3 | CDKN1A | 4511 8729 | 940 | 2.886 | 0.5532 | Yes | ||
| 4 | CALM3 | 8682 | 973 | 2.818 | 0.6602 | Yes | ||
| 5 | PPP3CB | 5285 | 1113 | 2.475 | 0.7482 | Yes | ||
| 6 | PRKCB1 | 1693 9574 | 1672 | 1.605 | 0.7802 | Yes | ||
| 7 | CALM2 | 8681 | 1752 | 1.490 | 0.8334 | Yes | ||
| 8 | NFATC1 | 23398 1999 5167 9455 1985 1957 | 2241 | 0.988 | 0.8453 | Yes | ||
| 9 | NFATC3 | 5169 | 3159 | 0.379 | 0.8106 | No | ||
| 10 | SP1 | 9852 | 3926 | 0.165 | 0.7758 | No | ||
| 11 | PRKCA | 20174 | 4927 | 0.066 | 0.7246 | No | ||
| 12 | SP3 | 5483 | 6109 | 0.032 | 0.6623 | No | ||
| 13 | SYT1 | 5565 | 7160 | 0.014 | 0.6064 | No | ||
| 14 | PPP3CA | 1863 5284 | 10076 | -0.024 | 0.4506 | No | ||
| 15 | NFATC4 | 22002 | 10479 | -0.030 | 0.4301 | No | ||
| 16 | NFATC2 | 5168 2866 | 10498 | -0.030 | 0.4303 | No | ||
| 17 | PLCG1 | 14753 | 10828 | -0.036 | 0.4140 | No | ||
| 18 | CALM1 | 21184 | 11385 | -0.046 | 0.3859 | No | ||
| 19 | GNAQ | 4786 23909 3685 | 12422 | -0.073 | 0.3330 | No |

