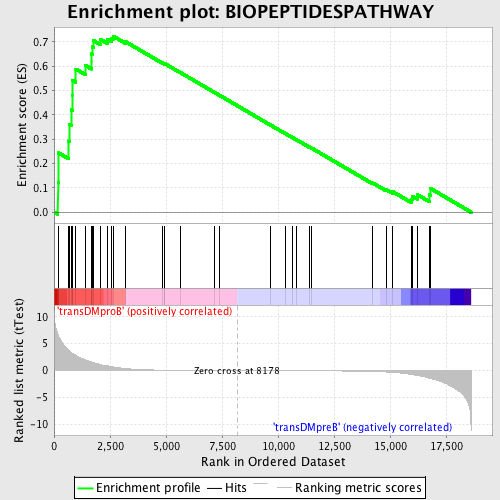
Profile of the Running ES Score & Positions of GeneSet Members on the Rank Ordered List
| Dataset | Set_04_transDMproB_versus_transDMpreB.phenotype_transDMproB_versus_transDMpreB.cls #transDMproB_versus_transDMpreB.phenotype_transDMproB_versus_transDMpreB.cls #transDMproB_versus_transDMpreB_repos |
| Phenotype | phenotype_transDMproB_versus_transDMpreB.cls#transDMproB_versus_transDMpreB_repos |
| Upregulated in class | transDMproB |
| GeneSet | BIOPEPTIDESPATHWAY |
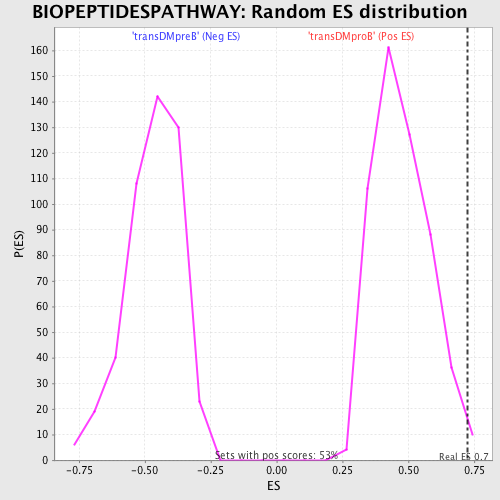
| Enrichment Score (ES) | 0.72326416 |
| Normalized Enrichment Score (NES) | 1.5284606 |
| Nominal p-value | 0.009398496 |
| FDR q-value | 0.25205252 |
| FWER p-Value | 0.905 |

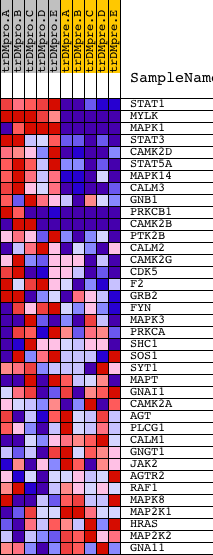
| PROBE | DESCRIPTION (from dataset) | GENE SYMBOL | GENE_TITLE | RANK IN GENE LIST | RANK METRIC SCORE | RUNNING ES | CORE ENRICHMENT | |
|---|---|---|---|---|---|---|---|---|
| 1 | STAT1 | 3936 5524 | 173 | 6.741 | 0.1214 | Yes | ||
| 2 | MYLK | 22778 4213 | 200 | 6.379 | 0.2437 | Yes | ||
| 3 | MAPK1 | 1642 11167 | 646 | 3.755 | 0.2925 | Yes | ||
| 4 | STAT3 | 5525 9906 | 681 | 3.642 | 0.3613 | Yes | ||
| 5 | CAMK2D | 4232 | 775 | 3.295 | 0.4202 | Yes | ||
| 6 | STAT5A | 20664 | 824 | 3.180 | 0.4793 | Yes | ||
| 7 | MAPK14 | 23313 | 828 | 3.176 | 0.5407 | Yes | ||
| 8 | CALM3 | 8682 | 973 | 2.818 | 0.5876 | Yes | ||
| 9 | GNB1 | 15967 | 1402 | 1.958 | 0.6025 | Yes | ||
| 10 | PRKCB1 | 1693 9574 | 1672 | 1.605 | 0.6192 | Yes | ||
| 11 | CAMK2B | 20536 | 1673 | 1.604 | 0.6503 | Yes | ||
| 12 | PTK2B | 21776 | 1704 | 1.562 | 0.6790 | Yes | ||
| 13 | CALM2 | 8681 | 1752 | 1.490 | 0.7053 | Yes | ||
| 14 | CAMK2G | 21905 | 2068 | 1.101 | 0.7097 | Yes | ||
| 15 | CDK5 | 16591 | 2378 | 0.862 | 0.7098 | Yes | ||
| 16 | F2 | 14524 | 2573 | 0.720 | 0.7133 | Yes | ||
| 17 | GRB2 | 20149 | 2633 | 0.675 | 0.7233 | Yes | ||
| 18 | FYN | 3375 3395 20052 | 3206 | 0.359 | 0.6994 | No | ||
| 19 | MAPK3 | 6458 11170 | 4819 | 0.071 | 0.6141 | No | ||
| 20 | PRKCA | 20174 | 4927 | 0.066 | 0.6096 | No | ||
| 21 | SHC1 | 9813 9812 5430 | 4928 | 0.066 | 0.6109 | No | ||
| 22 | SOS1 | 5476 | 5642 | 0.043 | 0.5733 | No | ||
| 23 | SYT1 | 5565 | 7160 | 0.014 | 0.4920 | No | ||
| 24 | MAPT | 9420 1347 | 7403 | 0.011 | 0.4791 | No | ||
| 25 | GNAI1 | 9024 | 9647 | -0.018 | 0.3588 | No | ||
| 26 | CAMK2A | 2024 23541 1980 | 10344 | -0.028 | 0.3219 | No | ||
| 27 | AGT | 18711 | 10639 | -0.033 | 0.3067 | No | ||
| 28 | PLCG1 | 14753 | 10828 | -0.036 | 0.2972 | No | ||
| 29 | CALM1 | 21184 | 11385 | -0.046 | 0.2682 | No | ||
| 30 | GNGT1 | 17533 | 11492 | -0.049 | 0.2635 | No | ||
| 31 | JAK2 | 23893 9197 3706 | 14224 | -0.188 | 0.1201 | No | ||
| 32 | AGTR2 | 24365 | 14815 | -0.274 | 0.0937 | No | ||
| 33 | RAF1 | 17035 | 15103 | -0.349 | 0.0850 | No | ||
| 34 | MAPK8 | 6459 | 15940 | -0.722 | 0.0540 | No | ||
| 35 | MAP2K1 | 19082 | 15996 | -0.765 | 0.0659 | No | ||
| 36 | HRAS | 4868 | 16218 | -0.935 | 0.0721 | No | ||
| 37 | MAP2K2 | 19933 | 16752 | -1.439 | 0.0713 | No | ||
| 38 | GNA11 | 3300 3345 19670 | 16806 | -1.493 | 0.0974 | No |

