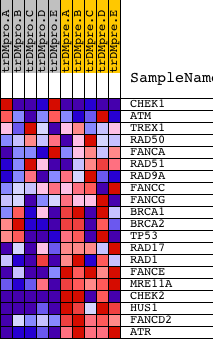
Profile of the Running ES Score & Positions of GeneSet Members on the Rank Ordered List
| Dataset | Set_04_transDMproB_versus_transDMpreB.phenotype_transDMproB_versus_transDMpreB.cls #transDMproB_versus_transDMpreB.phenotype_transDMproB_versus_transDMpreB.cls #transDMproB_versus_transDMpreB_repos |
| Phenotype | phenotype_transDMproB_versus_transDMpreB.cls#transDMproB_versus_transDMpreB_repos |
| Upregulated in class | transDMpreB |
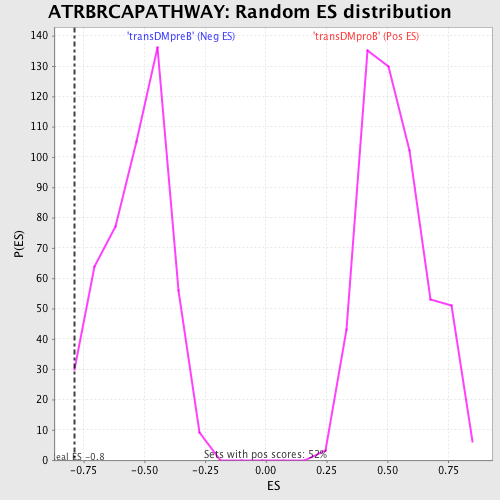
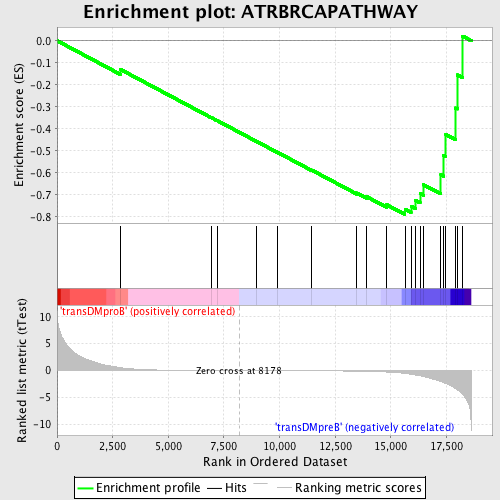
| GeneSet | ATRBRCAPATHWAY |
| Enrichment Score (ES) | -0.78918874 |
| Normalized Enrichment Score (NES) | -1.4798509 |
| Nominal p-value | 0.023060797 |
| FDR q-value | 0.18737638 |
| FWER p-Value | 0.985 |
| PROBE | DESCRIPTION (from dataset) | GENE SYMBOL | GENE_TITLE | RANK IN GENE LIST | RANK METRIC SCORE | RUNNING ES | CORE ENRICHMENT | |
|---|---|---|---|---|---|---|---|---|
| 1 | CHEK1 | 19181 3085 | 2838 | 0.535 | -0.1298 | No | ||
| 2 | ATM | 2976 19115 | 6926 | 0.018 | -0.3488 | No | ||
| 3 | TREX1 | 10219 3111 | 7204 | 0.014 | -0.3631 | No | ||
| 4 | RAD50 | 1198 20460 | 8948 | -0.010 | -0.4564 | No | ||
| 5 | FANCA | 18717 | 9921 | -0.022 | -0.5077 | No | ||
| 6 | RAD51 | 2897 14903 | 11436 | -0.047 | -0.5871 | No | ||
| 7 | RAD9A | 913 3674 910 23958 | 13472 | -0.120 | -0.6914 | No | ||
| 8 | FANCC | 4712 | 13928 | -0.157 | -0.7092 | No | ||
| 9 | FANCG | 15904 | 14820 | -0.276 | -0.7453 | No | ||
| 10 | BRCA1 | 20213 | 15637 | -0.546 | -0.7659 | Yes | ||
| 11 | BRCA2 | 16612 | 15910 | -0.696 | -0.7508 | Yes | ||
| 12 | TP53 | 20822 | 16099 | -0.845 | -0.7248 | Yes | ||
| 13 | RAD17 | 21366 | 16316 | -1.000 | -0.6937 | Yes | ||
| 14 | RAD1 | 22507 | 16474 | -1.118 | -0.6544 | Yes | ||
| 15 | FANCE | 23318 | 17250 | -2.038 | -0.6091 | Yes | ||
| 16 | MRE11A | 3014 19560 | 17360 | -2.192 | -0.5215 | Yes | ||
| 17 | CHEK2 | 16751 3587 | 17471 | -2.381 | -0.4257 | Yes | ||
| 18 | HUS1 | 9138 4890 | 17904 | -3.363 | -0.3054 | Yes | ||
| 19 | FANCD2 | 17326 464 | 17992 | -3.627 | -0.1553 | Yes | ||
| 20 | ATR | 19349 | 18225 | -4.423 | 0.0210 | Yes |