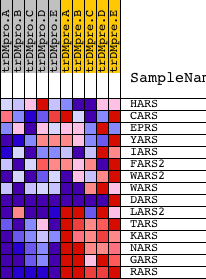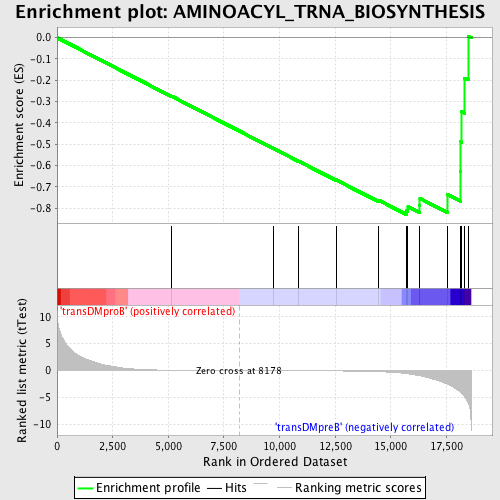
Profile of the Running ES Score & Positions of GeneSet Members on the Rank Ordered List
| Dataset | Set_04_transDMproB_versus_transDMpreB.phenotype_transDMproB_versus_transDMpreB.cls #transDMproB_versus_transDMpreB.phenotype_transDMproB_versus_transDMpreB.cls #transDMproB_versus_transDMpreB_repos |
| Phenotype | phenotype_transDMproB_versus_transDMpreB.cls#transDMproB_versus_transDMpreB_repos |
| Upregulated in class | transDMpreB |
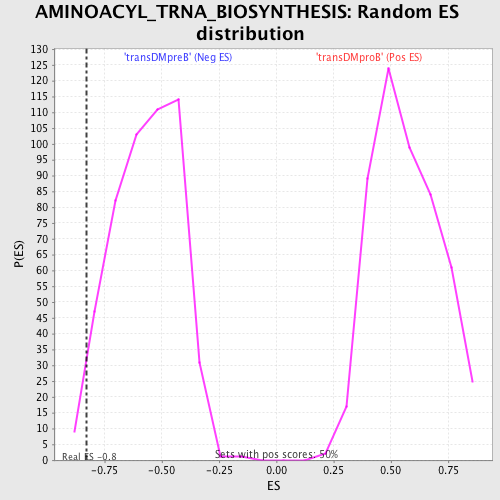
| GeneSet | AMINOACYL_TRNA_BIOSYNTHESIS |
| Enrichment Score (ES) | -0.8298221 |
| Normalized Enrichment Score (NES) | -1.4666941 |
| Nominal p-value | 0.024048096 |
| FDR q-value | 0.1977518 |
| FWER p-Value | 0.996 |
| PROBE | DESCRIPTION (from dataset) | GENE SYMBOL | GENE_TITLE | RANK IN GENE LIST | RANK METRIC SCORE | RUNNING ES | CORE ENRICHMENT | |
|---|---|---|---|---|---|---|---|---|
| 1 | HARS | 23451 | 5159 | 0.058 | -0.2754 | No | ||
| 2 | CARS | 1683 17544 | 9714 | -0.019 | -0.5195 | No | ||
| 3 | EPRS | 14014 | 10848 | -0.036 | -0.5792 | No | ||
| 4 | YARS | 16071 | 12538 | -0.078 | -0.6674 | No | ||
| 5 | IARS | 4190 8361 8362 | 14448 | -0.217 | -0.7626 | No | ||
| 6 | FARS2 | 21666 | 15699 | -0.576 | -0.8103 | Yes | ||
| 7 | WARS2 | 12884 7688 | 15771 | -0.614 | -0.7933 | Yes | ||
| 8 | WARS | 2085 20984 | 16287 | -0.993 | -0.7872 | Yes | ||
| 9 | DARS | 10375 13846 | 16309 | -0.999 | -0.7545 | Yes | ||
| 10 | LARS2 | 19255 | 17541 | -2.496 | -0.7360 | Yes | ||
| 11 | TARS | 22325 8502 | 18141 | -4.105 | -0.6289 | Yes | ||
| 12 | KARS | 18738 | 18148 | -4.127 | -0.4892 | Yes | ||
| 13 | NARS | 23418 | 18178 | -4.222 | -0.3475 | Yes | ||
| 14 | GARS | 17438 | 18321 | -4.883 | -0.1895 | Yes | ||
| 15 | RARS | 20496 | 18480 | -6.052 | 0.0073 | Yes |