Profile of the Running ES Score & Positions of GeneSet Members on the Rank Ordered List
| Dataset | Set_04_transDMproB_versus_transDMpreB.phenotype_transDMproB_versus_transDMpreB.cls #transDMproB_versus_transDMpreB.phenotype_transDMproB_versus_transDMpreB.cls #transDMproB_versus_transDMpreB_repos |
| Phenotype | phenotype_transDMproB_versus_transDMpreB.cls#transDMproB_versus_transDMpreB_repos |
| Upregulated in class | transDMpreB |
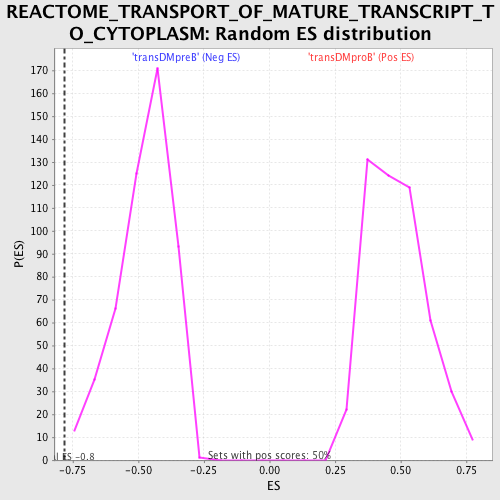
| GeneSet | REACTOME_TRANSPORT_OF_MATURE_TRANSCRIPT_TO_CYTOPLASM |
| Enrichment Score (ES) | -0.7824568 |
| Normalized Enrichment Score (NES) | -1.6422616 |
| Nominal p-value | 0.001984127 |
| FDR q-value | 0.018261924 |
| FWER p-Value | 0.313 |
| PROBE | DESCRIPTION (from dataset) | GENE SYMBOL | GENE_TITLE | RANK IN GENE LIST | RANK METRIC SCORE | RUNNING ES | CORE ENRICHMENT | |
|---|---|---|---|---|---|---|---|---|
| 1 | SFRS7 | 22889 | 1763 | 1.472 | -0.0697 | No | ||
| 2 | NUP54 | 11231 11232 6516 | 2456 | 0.810 | -0.0930 | No | ||
| 3 | THOC4 | 5710 10114 | 2571 | 0.724 | -0.0868 | No | ||
| 4 | SFRS3 | 5428 23312 | 3086 | 0.418 | -0.1073 | No | ||
| 5 | NUP153 | 21474 | 5412 | 0.049 | -0.2316 | No | ||
| 6 | NUP35 | 12803 | 5937 | 0.036 | -0.2591 | No | ||
| 7 | U2AF2 | 5813 5812 5814 | 6448 | 0.026 | -0.2862 | No | ||
| 8 | RNPS1 | 9730 23361 | 7695 | 0.007 | -0.3531 | No | ||
| 9 | SLBP | 9822 | 10116 | -0.025 | -0.4829 | No | ||
| 10 | TPR | 927 4255 | 10181 | -0.026 | -0.4859 | No | ||
| 11 | EIF4E | 15403 1827 8890 | 10781 | -0.035 | -0.5175 | No | ||
| 12 | NUP188 | 15053 | 11986 | -0.060 | -0.5813 | No | ||
| 13 | SFRS1 | 8492 | 15244 | -0.391 | -0.7498 | No | ||
| 14 | SRRM1 | 6958 | 15782 | -0.618 | -0.7681 | No | ||
| 15 | SFRS2 | 9807 20136 | 16049 | -0.798 | -0.7688 | Yes | ||
| 16 | NFX1 | 2475 | 16077 | -0.824 | -0.7562 | Yes | ||
| 17 | NUP37 | 3294 3326 19909 | 16314 | -1.000 | -0.7517 | Yes | ||
| 18 | SFRS9 | 16731 | 16466 | -1.109 | -0.7409 | Yes | ||
| 19 | MAGOH | 2386 16148 | 16585 | -1.230 | -0.7262 | Yes | ||
| 20 | SFRS5 | 9808 2062 | 16665 | -1.319 | -0.7079 | Yes | ||
| 21 | NUP62 | 9497 | 16948 | -1.656 | -0.6947 | Yes | ||
| 22 | RANBP2 | 20019 | 17218 | -1.991 | -0.6751 | Yes | ||
| 23 | SFRS6 | 14751 | 17617 | -2.689 | -0.6505 | Yes | ||
| 24 | CPSF1 | 22241 | 17788 | -3.055 | -0.6073 | Yes | ||
| 25 | NUP160 | 14957 | 18027 | -3.726 | -0.5563 | Yes | ||
| 26 | NUPL2 | 6072 | 18049 | -3.784 | -0.4927 | Yes | ||
| 27 | NUP93 | 7762 | 18092 | -3.883 | -0.4285 | Yes | ||
| 28 | U2AF1 | 8431 | 18097 | -3.895 | -0.3620 | Yes | ||
| 29 | RAE1 | 12395 | 18159 | -4.157 | -0.2941 | Yes | ||
| 30 | NUP155 | 2298 5027 | 18189 | -4.257 | -0.2228 | Yes | ||
| 31 | NUP107 | 8337 | 18212 | -4.349 | -0.1495 | Yes | ||
| 32 | NCBP2 | 12643 | 18234 | -4.445 | -0.0746 | Yes | ||
| 33 | NUP43 | 20094 | 18428 | -5.554 | 0.0101 | Yes |