Profile of the Running ES Score & Positions of GeneSet Members on the Rank Ordered List
| Dataset | Set_04_transDMproB_versus_transDMpreB.phenotype_transDMproB_versus_transDMpreB.cls #transDMproB_versus_transDMpreB.phenotype_transDMproB_versus_transDMpreB.cls #transDMproB_versus_transDMpreB_repos |
| Phenotype | phenotype_transDMproB_versus_transDMpreB.cls#transDMproB_versus_transDMpreB_repos |
| Upregulated in class | transDMpreB |
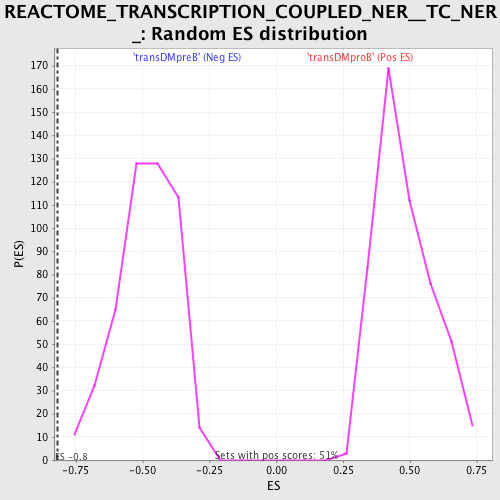
| GeneSet | REACTOME_TRANSCRIPTION_COUPLED_NER__TC_NER_ |
| Enrichment Score (ES) | -0.8177452 |
| Normalized Enrichment Score (NES) | -1.6859093 |
| Nominal p-value | 0.0 |
| FDR q-value | 0.0087434 |
| FWER p-Value | 0.127 |
| PROBE | DESCRIPTION (from dataset) | GENE SYMBOL | GENE_TITLE | RANK IN GENE LIST | RANK METRIC SCORE | RUNNING ES | CORE ENRICHMENT | |
|---|---|---|---|---|---|---|---|---|
| 1 | POLD1 | 17847 | 2113 | 1.052 | -0.0961 | No | ||
| 2 | POLR2I | 12839 | 4567 | 0.087 | -0.2267 | No | ||
| 3 | POLR2B | 16817 | 9561 | -0.017 | -0.4950 | No | ||
| 4 | POLE2 | 21053 | 10840 | -0.036 | -0.5632 | No | ||
| 5 | POLR2C | 9750 | 11135 | -0.042 | -0.5783 | No | ||
| 6 | CDK7 | 21365 | 11619 | -0.052 | -0.6035 | No | ||
| 7 | ERCC2 | 1549 18363 3812 | 12015 | -0.061 | -0.6237 | No | ||
| 8 | GTF2H1 | 4069 18236 | 12248 | -0.068 | -0.6350 | No | ||
| 9 | PCNA | 9535 | 14678 | -0.252 | -0.7615 | No | ||
| 10 | MNAT1 | 9396 2161 | 14706 | -0.256 | -0.7587 | No | ||
| 11 | POLD3 | 17742 | 15292 | -0.408 | -0.7834 | No | ||
| 12 | RPA1 | 20349 | 15833 | -0.646 | -0.8016 | Yes | ||
| 13 | POLR2A | 5394 | 16021 | -0.780 | -0.7986 | Yes | ||
| 14 | LIG1 | 18388 1749 1493 | 16377 | -1.029 | -0.8005 | Yes | ||
| 15 | ERCC5 | 14255 4097 | 16472 | -1.117 | -0.7869 | Yes | ||
| 16 | ERCC1 | 1235 1045 1646 | 16562 | -1.213 | -0.7715 | Yes | ||
| 17 | RFC1 | 16527 | 16602 | -1.243 | -0.7528 | Yes | ||
| 18 | ERCC3 | 23605 | 16832 | -1.531 | -0.7395 | Yes | ||
| 19 | CCNH | 7322 | 16942 | -1.644 | -0.7179 | Yes | ||
| 20 | RFC3 | 12786 | 17029 | -1.726 | -0.6937 | Yes | ||
| 21 | POLR2E | 3325 19699 | 17108 | -1.814 | -0.6675 | Yes | ||
| 22 | POLR2G | 23753 | 17143 | -1.872 | -0.6381 | Yes | ||
| 23 | RPA2 | 2330 16057 | 17569 | -2.561 | -0.6181 | Yes | ||
| 24 | POLR2J | 16672 | 17714 | -2.890 | -0.5776 | Yes | ||
| 25 | RPA3 | 12667 | 17797 | -3.079 | -0.5305 | Yes | ||
| 26 | RFC5 | 13005 7791 | 18005 | -3.668 | -0.4803 | Yes | ||
| 27 | GTF2H3 | 5551 | 18028 | -3.729 | -0.4192 | Yes | ||
| 28 | POLE | 16755 | 18111 | -3.955 | -0.3575 | Yes | ||
| 29 | RFC4 | 1735 22627 | 18132 | -4.059 | -0.2907 | Yes | ||
| 30 | ERCC8 | 12982 3255 3187 | 18168 | -4.177 | -0.2228 | Yes | ||
| 31 | GTF2H2 | 6236 | 18200 | -4.311 | -0.1524 | Yes | ||
| 32 | POLR2H | 10888 | 18316 | -4.847 | -0.0776 | Yes | ||
| 33 | POLD2 | 20537 | 18438 | -5.603 | 0.0096 | Yes |