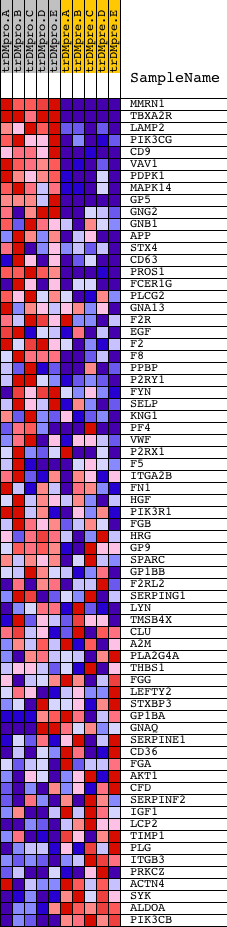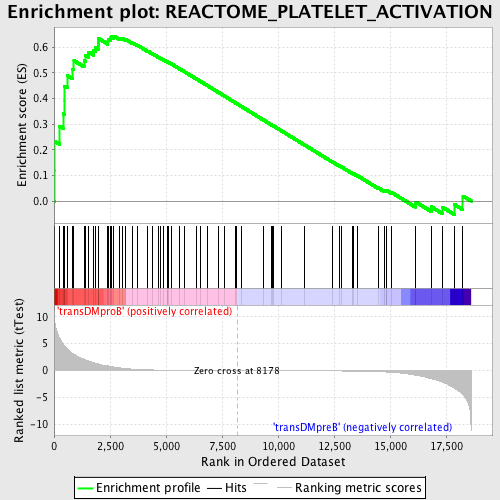
Profile of the Running ES Score & Positions of GeneSet Members on the Rank Ordered List
| Dataset | Set_04_transDMproB_versus_transDMpreB.phenotype_transDMproB_versus_transDMpreB.cls #transDMproB_versus_transDMpreB.phenotype_transDMproB_versus_transDMpreB.cls #transDMproB_versus_transDMpreB_repos |
| Phenotype | phenotype_transDMproB_versus_transDMpreB.cls#transDMproB_versus_transDMpreB_repos |
| Upregulated in class | transDMproB |
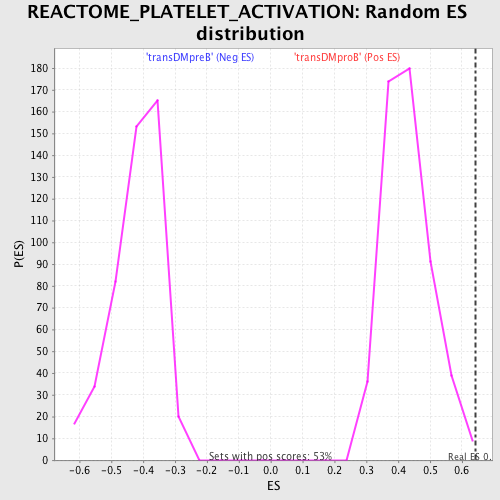
| GeneSet | REACTOME_PLATELET_ACTIVATION |
| Enrichment Score (ES) | 0.6430902 |
| Normalized Enrichment Score (NES) | 1.5055187 |
| Nominal p-value | 0.0018903592 |
| FDR q-value | 0.40155402 |
| FWER p-Value | 0.992 |
| PROBE | DESCRIPTION (from dataset) | GENE SYMBOL | GENE_TITLE | RANK IN GENE LIST | RANK METRIC SCORE | RUNNING ES | CORE ENRICHMENT | |
|---|---|---|---|---|---|---|---|---|
| 1 | MMRN1 | 17428 | 15 | 9.905 | 0.1174 | Yes | ||
| 2 | TBXA2R | 3392 19928 | 17 | 9.752 | 0.2338 | Yes | ||
| 3 | LAMP2 | 9267 2653 | 252 | 5.962 | 0.2923 | Yes | ||
| 4 | PIK3CG | 6635 | 432 | 4.773 | 0.3397 | Yes | ||
| 5 | CD9 | 16992 | 460 | 4.608 | 0.3932 | Yes | ||
| 6 | VAV1 | 23173 | 461 | 4.594 | 0.4480 | Yes | ||
| 7 | PDPK1 | 23097 | 588 | 4.023 | 0.4893 | Yes | ||
| 8 | MAPK14 | 23313 | 828 | 3.176 | 0.5143 | Yes | ||
| 9 | GP5 | 22616 | 885 | 3.044 | 0.5476 | Yes | ||
| 10 | GNG2 | 4790 | 1339 | 2.062 | 0.5478 | Yes | ||
| 11 | GNB1 | 15967 | 1402 | 1.958 | 0.5678 | Yes | ||
| 12 | APP | 4402 | 1546 | 1.753 | 0.5810 | Yes | ||
| 13 | STX4 | 18062 | 1769 | 1.464 | 0.5866 | Yes | ||
| 14 | CD63 | 8716 | 1851 | 1.348 | 0.5983 | Yes | ||
| 15 | PROS1 | 22725 | 1965 | 1.207 | 0.6066 | Yes | ||
| 16 | FCER1G | 13759 | 1971 | 1.199 | 0.6206 | Yes | ||
| 17 | PLCG2 | 18453 | 1989 | 1.180 | 0.6338 | Yes | ||
| 18 | GNA13 | 20617 | 2402 | 0.850 | 0.6217 | Yes | ||
| 19 | F2R | 21386 | 2408 | 0.848 | 0.6316 | Yes | ||
| 20 | EGF | 15169 | 2502 | 0.778 | 0.6359 | Yes | ||
| 21 | F2 | 14524 | 2573 | 0.720 | 0.6407 | Yes | ||
| 22 | F8 | 2584 24123 | 2672 | 0.645 | 0.6431 | Yes | ||
| 23 | PPBP | 16801 | 2930 | 0.486 | 0.6350 | No | ||
| 24 | P2RY1 | 15581 | 3030 | 0.444 | 0.6350 | No | ||
| 25 | FYN | 3375 3395 20052 | 3206 | 0.359 | 0.6299 | No | ||
| 26 | SELP | 14073 | 3515 | 0.255 | 0.6163 | No | ||
| 27 | KNG1 | 9244 22809 | 3724 | 0.205 | 0.6075 | No | ||
| 28 | PF4 | 16800 | 4170 | 0.128 | 0.5851 | No | ||
| 29 | VWF | 17277 | 4407 | 0.100 | 0.5735 | No | ||
| 30 | P2RX1 | 20794 1294 | 4657 | 0.081 | 0.5611 | No | ||
| 31 | F5 | 8941 | 4765 | 0.075 | 0.5562 | No | ||
| 32 | ITGA2B | 9186 | 4903 | 0.067 | 0.5496 | No | ||
| 33 | FN1 | 4091 4094 971 13929 | 5046 | 0.061 | 0.5427 | No | ||
| 34 | HGF | 16916 | 5055 | 0.061 | 0.5430 | No | ||
| 35 | PIK3R1 | 3170 | 5108 | 0.059 | 0.5409 | No | ||
| 36 | FGB | 15309 | 5250 | 0.055 | 0.5339 | No | ||
| 37 | HRG | 22810 | 5618 | 0.044 | 0.5147 | No | ||
| 38 | GP9 | 17374 | 5804 | 0.038 | 0.5052 | No | ||
| 39 | SPARC | 20444 | 6363 | 0.027 | 0.4754 | No | ||
| 40 | GP1BB | 9031 | 6536 | 0.024 | 0.4664 | No | ||
| 41 | F2RL2 | 21580 | 6852 | 0.019 | 0.4497 | No | ||
| 42 | SERPING1 | 14546 | 7356 | 0.012 | 0.4227 | No | ||
| 43 | LYN | 16281 | 7605 | 0.008 | 0.4094 | No | ||
| 44 | TMSB4X | 24005 | 8116 | 0.001 | 0.3819 | No | ||
| 45 | CLU | 21979 | 8159 | 0.000 | 0.3797 | No | ||
| 46 | A2M | 17298 | 8372 | -0.003 | 0.3683 | No | ||
| 47 | PLA2G4A | 13809 | 9334 | -0.015 | 0.3166 | No | ||
| 48 | THBS1 | 5748 14910 | 9690 | -0.019 | 0.2977 | No | ||
| 49 | FGG | 1891 | 9760 | -0.020 | 0.2942 | No | ||
| 50 | LEFTY2 | 6735 | 9783 | -0.020 | 0.2933 | No | ||
| 51 | STXBP3 | 9931 | 10130 | -0.025 | 0.2749 | No | ||
| 52 | GP1BA | 13683 | 11180 | -0.042 | 0.2189 | No | ||
| 53 | GNAQ | 4786 23909 3685 | 12422 | -0.073 | 0.1528 | No | ||
| 54 | SERPINE1 | 16333 | 12748 | -0.085 | 0.1363 | No | ||
| 55 | CD36 | 8712 | 12848 | -0.088 | 0.1320 | No | ||
| 56 | FGA | 1780 15566 | 13331 | -0.111 | 0.1074 | No | ||
| 57 | AKT1 | 8568 | 13376 | -0.114 | 0.1064 | No | ||
| 58 | CFD | 19957 | 13564 | -0.127 | 0.0978 | No | ||
| 59 | SERPINF2 | 9589 20348 | 14470 | -0.220 | 0.0516 | No | ||
| 60 | IGF1 | 3352 9156 3409 | 14748 | -0.264 | 0.0399 | No | ||
| 61 | LCP2 | 4988 9268 | 14824 | -0.276 | 0.0391 | No | ||
| 62 | TIMP1 | 24366 | 14843 | -0.280 | 0.0415 | No | ||
| 63 | PLG | 1593 23383 | 15062 | -0.337 | 0.0337 | No | ||
| 64 | ITGB3 | 20631 | 16124 | -0.865 | -0.0131 | No | ||
| 65 | PRKCZ | 5260 | 16150 | -0.885 | -0.0039 | No | ||
| 66 | ACTN4 | 17905 1798 1983 | 16837 | -1.534 | -0.0226 | No | ||
| 67 | SYK | 21636 | 17335 | -2.157 | -0.0236 | No | ||
| 68 | ALDOA | 8572 | 17869 | -3.252 | -0.0136 | No | ||
| 69 | PIK3CB | 19030 | 18252 | -4.506 | 0.0196 | No |