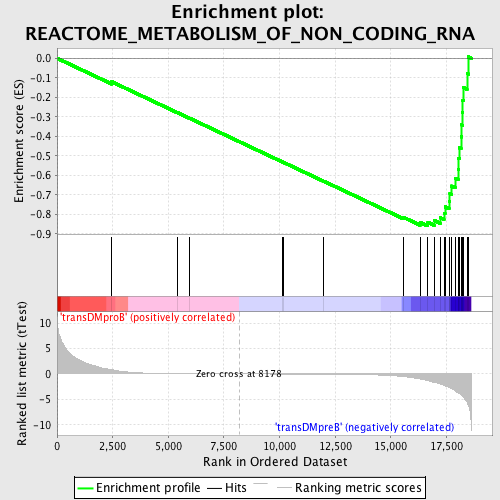
Profile of the Running ES Score & Positions of GeneSet Members on the Rank Ordered List
| Dataset | Set_04_transDMproB_versus_transDMpreB.phenotype_transDMproB_versus_transDMpreB.cls #transDMproB_versus_transDMpreB.phenotype_transDMproB_versus_transDMpreB.cls #transDMproB_versus_transDMpreB_repos |
| Phenotype | phenotype_transDMproB_versus_transDMpreB.cls#transDMproB_versus_transDMpreB_repos |
| Upregulated in class | transDMpreB |
| GeneSet | REACTOME_METABOLISM_OF_NON_CODING_RNA |
| Enrichment Score (ES) | -0.8591949 |
| Normalized Enrichment Score (NES) | -1.715356 |
| Nominal p-value | 0.0 |
| FDR q-value | 0.0044350494 |
| FWER p-Value | 0.058 |
| PROBE | DESCRIPTION (from dataset) | GENE SYMBOL | GENE_TITLE | RANK IN GENE LIST | RANK METRIC SCORE | RUNNING ES | CORE ENRICHMENT | |
|---|---|---|---|---|---|---|---|---|
| 1 | NUP54 | 11231 11232 6516 | 2456 | 0.810 | -0.1203 | No | ||
| 2 | NUP153 | 21474 | 5412 | 0.049 | -0.2785 | No | ||
| 3 | NUP35 | 12803 | 5937 | 0.036 | -0.3062 | No | ||
| 4 | SNRPE | 9843 | 10126 | -0.025 | -0.5311 | No | ||
| 5 | TPR | 927 4255 | 10181 | -0.026 | -0.5337 | No | ||
| 6 | NUP188 | 15053 | 11986 | -0.060 | -0.6298 | No | ||
| 7 | SNRPB | 9842 5469 2736 | 15571 | -0.515 | -0.8151 | No | ||
| 8 | NUP37 | 3294 3326 19909 | 16314 | -1.000 | -0.8404 | Yes | ||
| 9 | SNRPG | 12622 | 16664 | -1.317 | -0.8400 | Yes | ||
| 10 | NUP62 | 9497 | 16948 | -1.656 | -0.8310 | Yes | ||
| 11 | RANBP2 | 20019 | 17218 | -1.991 | -0.8165 | Yes | ||
| 12 | SNRPF | 7645 | 17393 | -2.259 | -0.7929 | Yes | ||
| 13 | GEMIN4 | 6592 6591 | 17440 | -2.337 | -0.7612 | Yes | ||
| 14 | SIP1 | 21263 | 17619 | -2.696 | -0.7315 | Yes | ||
| 15 | SNUPN | 12282 | 17654 | -2.754 | -0.6931 | Yes | ||
| 16 | SNRPD3 | 12514 | 17723 | -2.911 | -0.6543 | Yes | ||
| 17 | SNRPD2 | 8412 | 17892 | -3.333 | -0.6147 | Yes | ||
| 18 | NUP160 | 14957 | 18027 | -3.726 | -0.5676 | Yes | ||
| 19 | NUPL2 | 6072 | 18049 | -3.784 | -0.5135 | Yes | ||
| 20 | NUP93 | 7762 | 18092 | -3.883 | -0.4591 | Yes | ||
| 21 | RAE1 | 12395 | 18159 | -4.157 | -0.4020 | Yes | ||
| 22 | NUP155 | 2298 5027 | 18189 | -4.257 | -0.3414 | Yes | ||
| 23 | NUP107 | 8337 | 18212 | -4.349 | -0.2792 | Yes | ||
| 24 | NCBP2 | 12643 | 18234 | -4.445 | -0.2154 | Yes | ||
| 25 | CLNS1A | 4526 4525 | 18262 | -4.554 | -0.1504 | Yes | ||
| 26 | NUP43 | 20094 | 18428 | -5.554 | -0.0783 | Yes | ||
| 27 | PRMT5 | 6571 2817 | 18481 | -6.055 | 0.0073 | Yes |

